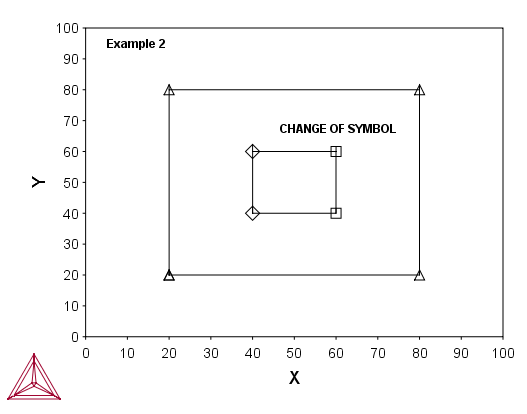
Example 2 – Draw Polygons and Symbols
The macro text below produces the example output. You can copy the text into your own EXP file, or use the example file DATAPLOT 2 - Draw Polygons and Symbols.EXP available with your installation. To open the folder: From the Thermo‑Calc menu, select Help → Manuals Folder.
Output Example
Macro Text
$DATAPLOT Example 2
PROLOG 2 EXAMPLE 2 0<X<100, 0<Y<100
XSCALE 0.00000 100
YSCALE 0.00000 100
XTYPE LINEAR
YTYPE LINEAR
XLENGTH 11.5000
YLENGTH 11.5000
TITLE EXAMPLE 2
XTEXT X
YTEXT Y
DATASET 2 Two ploygons with three types of symbols
ATTRIBUTE CENTER
CLIP OFF
0.05 0.95 N'Example 2
1.1 0.95 NS1'SYMBOL 1
1.1 0.90 NS2'SYMBOL 2
1.1 0.85 NS3'SYMBOL 3
BLOCK X=C1; Y=C2; GOC=C3,DSWA
40 40 M
40 60
60 60 S2'CHANGE OF SYMBOL
60 40
40 40 S0
BLOCKEND
BLOCK X=C1*100; Y=C2*100; GOC=C3,DSWA
0.2 0.2 MS1
0.2 0.8
0.8 0.8
0.8 0.2
0.2 0.2
BLOCKEND
$Draw an additional polygon:
DRAWLINE 20,10 30,15 40,30 50,80
DRAWLINE 50,80 60,60 90,30
