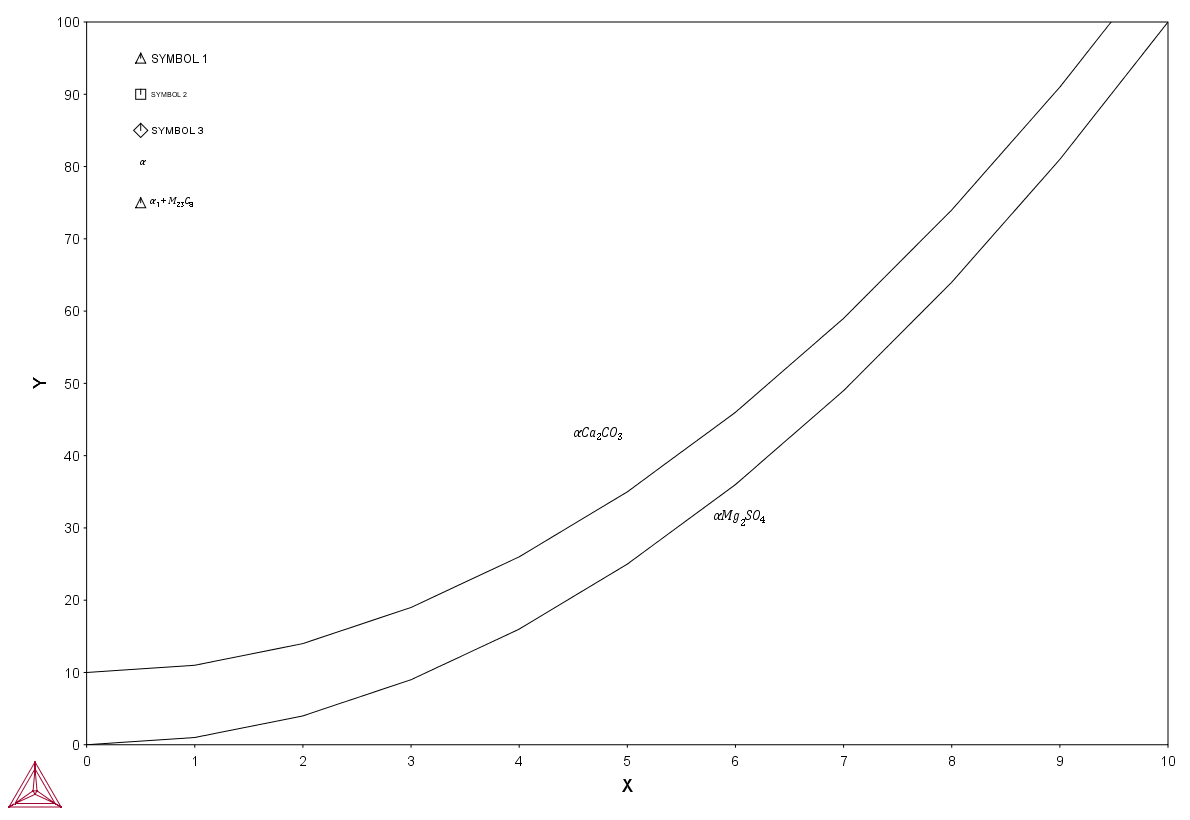
Example 3 – Using Strings and Various Line Types
The macro text below produces the example output. You can copy the text into your own EXP file, or use the example file DATAPLOT 3 - Using String and Line Types.EXP available with your installation. To open the folder: From the Thermo‑Calc menu, select Help → Manuals Folder.
Output Example
Macro Text
$DATAPLOT Example 3
PROLOG 3 EXAMPLE 3 0<X<10, 0<Y<100
XSCALE 0.00000 10
YSCALE 0.00000 100
XTYPE LINEAR
YTYPE LINEAR
XLENGTH 11.5000
YLENGTH 11.5000
TITLE EXAMPLE 3
XTEXT X
YTEXT Y
DATASET 3 Draw curves; plot formatted texts and symbols
$Define some strings:
STRING BCC \latex \alpha
STRING BCC1 \latex \alpha_1 + M_23C_8
STRING M23C6 M_23C_6
STRING ACA2CO3 \latex \alpha Ca_2CO_3
STRING AMG2SO4 \latex \alpha Mg_2SO_4
ATTRIBUTE CENTER
CLIP OFF
FONT 2
0.05 0.95 NS1'SYMBOL 1
CHARSIZE 0.2
0.05 0.90 NS2' SYMBOL 2
CHARSIZE 0.3
0.05 0.85 NS3'SYMBOL 3
0.05 0.80 N' ~BCC
0.05 0.75 NS1'~BCC1
SYMBOLSIZE 0.4
CHARSIZE 0.4
0.45 0.42 N'~ACA2CO3
0.58 0.30 N'~AMG2SO4
CLIP ON
LINETYPE 1
BLOCK X=C1; Y=C1*C1; GOC=C2, DWA
0 M
1
2
3
4
5
6
7
8
9
10
BLOCKEND
LINETYPE 2
BLOCK X=C1; Y=C1*C1+10; GOC=C2, DWA
0 M
1
2
3
4
5
6
7
8
9
10
BLOCKEND
