About the Activity Nodes
Graphical Mode Activities vs Console Mode Modules
In a project, a set of linked activities is called a tree. A result calculated within a tree is fed as input into the next activity in the tree. Consequently, if you have an Equilibrium Calculator with another Equilibrium Calculator as its successor, the successor takes the calculation results of the predecessor as the starting values for its calculation. When working with activities in the Project window these are also referred to as nodes (or activity nodes) in the tree structure.
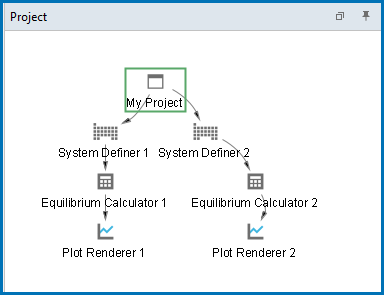
The example below shows a  My Project node with two trees. In each tree, settings and calculation results are propagated downward until the calculation and the visualization of the results are completed in the Plot Renderer nodes.
The system definitions, settings, and calculation results of the two trees are independent of each other in this example.
There are several resources available on our website to help you learn how to use Thermo‑Calc and other Add-on Modules. Go to the Getting Started Guides page and choose one of the guides that provides new users an introduction to setting up simple calculations in Graphical Mode. The information there is also in this help documentation.
Activity Successor and Predecessor Nodes
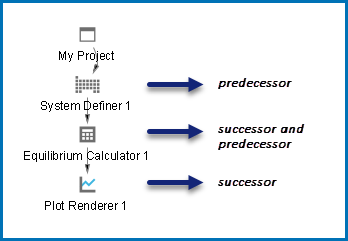
An activity node located below another activity node in a tree is referred to as that activity’s successor. An activity located above another activity is called that activity’s predecessor. A predecessor is performed before the predecessor’s successors and its result is fed forward to any successor activities.
For example, to calculate and display a phase diagram, create a branch with three linked activities: A System Definer activity linked to an Equilibrium Calculator activity, which in turn is connected to a Plot Renderer activity.
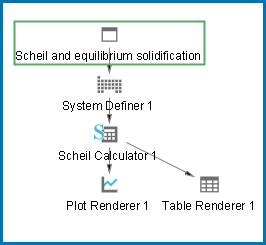
You can determine the available successors by right-clicking a node in the Project window to browse what is available from the menu and follow the arrows connecting the nodes. The example below shows that Scheil Calculator 1 is a predecessor to the successors, Plot Renderer 1 and Table Render 1.
Creating Activities and Successors and Cloning Activities and Trees
The table below is a brief description of the activity types you work with in the Project window. When working with activities these are referred to as nodes in this documentation.
These are the project activity nodes available in Graphical Mode. Some of these require additional licenses for full feature availability. Listed in alphabetical order.
| Activity Type | Description |
|---|---|
|
Using the Additive Manufacturing (AM) Module this activity is used in conjunction with either the Scheil Calculator or a Material Library to define the necessary settings to better understand the laser powder bed fusion (LPBF) process by predicting the temperature distribution and melt pool geometry as a function of process parameters. There is also connectivity with the Diffusion Calculator and Precipitation Calculator to include probe data with a Thermal Profile calculation. In DEMO mode you can view the settings and experiment with some things, but no calculations can be run. |
|
|
Use it for some calculations involving two components only. It is like a combination of System Definer and Equilibrium Calculator activities with adaptations to simplify the configuration of calculations on binary systems. To perform this activity, you need a database designed for the Binary Calculator, such as the TCBIN database. |
|
|
Using the Diffusion Module (DICTRA), this activity is where you set the geometry, add one or more regions, enter grids and phases in the regions, and then enter compositions of phases. You can also use this in DEMO mode with up to three components. There is also connectivity to the Scheil Calculator and to other Add-on Modules such as the Additive Manufacturing (AM) Module. |
|
|
Set thermodynamic conditions and define axis variables when a series of equilibrium calculations are to be performed in one or more dimensions. |
|
|
Read experimental data files (*.EXP). This type of file contains information specifying a plotted diagram, written in the DATAPLOT graphical language. |
|
|
This activity calculates materials transitioning from one into the other. |
|
|
Determine the layout of non-text based output. |
|
|
Set the conditions for, and perform, a precipitation calculation using the Precipitation Module (TC-PRISMA). You can also use this in DEMO mode with up to three components. There is also specialized connectivity to the Yield Strength Property Model and to other Add-on Modules such as the Additive Manufacturing (AM) Module. |
|
|
This calculator allows for efficient setup of advanced calculations involving slag, metal and gas. Define the composition of a steel and slag system using material groups: one each for steel, slag and gas. |
|
|
Choose one or more General Models to predict and optimize material properties. You can evaluate models simultaneously over a range of compositions and cross plot the results. You can then conduct an uncertainty analysis and plot the results as either a histogram or as a probability plot. With additional licenses, there are material specific libraries, i.e. Steel Models, Nickel Models, and others available. |
|
|
Perform Scheil-Gulliver calculations (also known as Scheil calculations). A default Scheil calculation is used to estimate the solidification range of an alloy assuming that i) the liquid phase is homogeneous at all times and ii) the diffusivity is zero in the solid. However, it is possible to disregard the second assumption for selected components. The Scheil Calculator is also used with other specialized Add-on Modules such as the Diffusion Module (DICTRA) and Additive Manufacturing (AM) Module. |
|
|
Define a certain thermodynamic system and read it from file into memory. |
|
|
Use this activity for text-based output. |
|
|
Use it for some calculations involving three components. It is like a combination of System Definer and Equilibrium Calculator activities with adaptations to simplify the configuration of calculations on ternary systems. To get a reliable result you need a database that fully assesses binary and ternary systems. |


