Table Renderer
A Table Renderer visualizes calculation results in a table. Several Table Renderer activities (as well as Plot Renderer activities) can be shown in the Visualizations window as different tabs.
You can add the Table Renderer directly (right-click a calculator node and select it from the Create New Successor menu) or use a variety of the available templates to automatically add the node. For example, on the  My Projects Configuration window under Equilibrium, choose the Single Point or One Axis templates.
For details about the templates, see Getting Started Links and Templates and Creating a Project from a Template.
You can only successfully tabulate the results of a single equilibrium calculation or a stepping (i.e. property diagram) operation. The tabulated data from an equilibrium calculation is different from the tabulated data from a stepping calculation.
The settings are described in the section Table Renderer: Configuration Settings.
| Button | Name | Description |
|---|---|---|
| Save Table |
Once a calculation is performed and there is data in the table, click to save it. |
|
|
For the Plot Renderer, there is an option to use the |
||
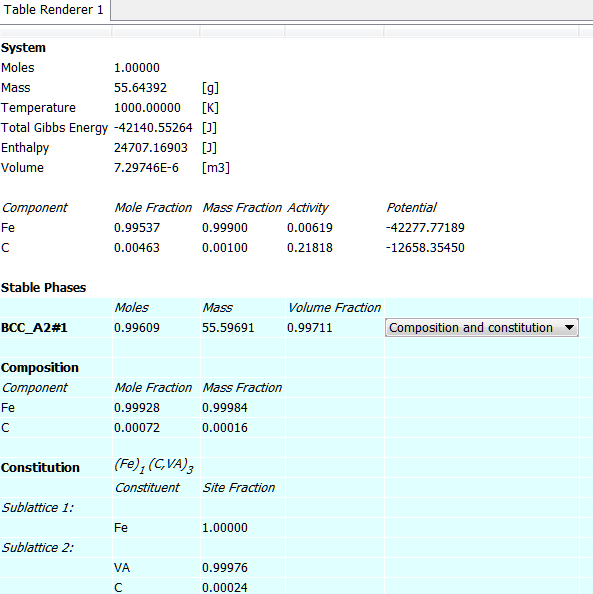
The following tab shows the result of an equilibrium calculation (from example T_01: Calculating a Single-Point Equilibrium).
For each stable phase listed, from the Composition and constitution menu you can select the information to view. In this example, the maximum amount of information is shown and includes details about both composition and constitution for BCC_A2#1.
The default for the Phase description detail can be changed globally from the Options window.
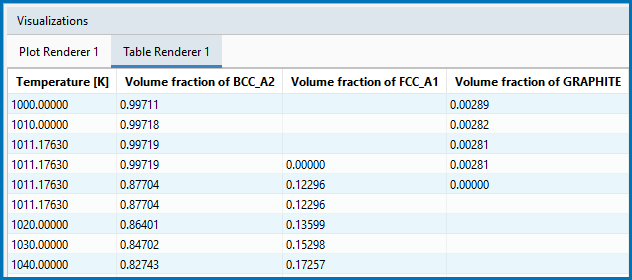
The Table Render 1 tab in the example shows the results of a stepping calculation (where a Table Renderer is added to the example in T_02: Stepping in Temperature in the Fe-C System).
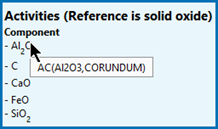
When you use a Process Metallurgy Calculator with a Single equilibrium calculation, there is a variety of additional information you can display in the table such as the Slag properties (see Process Metallurgy Slag Properties for equations and references) and the Activities.
PMET_01: Basic Oxygen Furnace (BOF). Using version 01b, added a Table Renderer and did a Single calculation.
For the activities in the table, you can hover over the Component and the syntax of the activity displays.
The Yield Strength Property Model: Simplified Mode Settings is available with the Property Model Calculator. After defining the Model and adding a Table or Plot, all yield strength quantities are available to select from this list. These yield strength quantities are also accessible via a Table Renderer (or Plot Renderer) that is a successor to the Precipitation Calculator.
For details about the quantities, see About the Yield Strength Property Model.
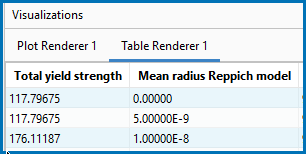
This uses the PM_G_05: Yield Strength NiAlCr example and then a Table Renderer is added. Alternatively, you can click the Table View  button and reperform the Plot Renderer for the same results.
An example of the results when yield strength is chosen as the Axis variable for a Table Renderer that is a successor to the Property Model Calculator.
These settings are described in the Precipitation Calculator Plot Renderer.


