AM_10: CET Transition in an IN718 Alloy
The example uses a Scheil Calculator, AM Calculator, and the Property Model Calculator with the Columnar to Equiaxed Transition Property Model to compare calculated CET curves for an IN718 alloy (from example PM_G_17) with the solidification conditions of the melt pool in the AM simulation.
This example is similar to, and based on, the Property Model example PM_G_17: Columnar to Equiaxed Transition of an IN718 Alloy.
For more background about the Property Model, see About the Columnar to Equiaxed Transition (CET) Property Model.
A Scheil with solute trapping calculation is done first on the Scheil Calculator to generate thermophysical properties data to the AM Calculator. A steady-state AM simulation is done to predict the solidification conditions in the melt pool, the solidification rates, and thermal gradients.
Then using the Property Model Calculator with the Columnar to Equiaxed Transition (CET) model, the calculated CET curves for an IN718 alloy are fed into the AM + CET node (the renamed Plot Renderer), where together the data from the AM and Property Model calculations are combined and overlaid on one plot.
The literature data from Polonsky et al. [2020Pol] are not purely experimental data, but rather combined with experimental equiaxed evidence and model calculations with numerical values of thermal gradients, growth velocity as well as tip undercooling. Polonsky et al. estimated tip undercooling based on a Scheil calculation, which smeared out the composition inhomogeneity at the dendrite front, hence underestimating the undercooling. Since both tip undercooling and nucleation site density promotes the formation of equiaxed crystals, an increase in undercooling in this example calculation leads to a decrease in nucleation site density compared to the results in [2020Pol] if one were fitting the same set of data.
- Folder: Additive Manufacturing
- File name:
AM_10_Columnar_to_Equiaxed_Transition_IN718.tcu
A separate license is required to perform calculations with the Additive Manufacturing (AM) Module. This example also requires additional database licenses for the TCS Ni-based Superalloys Database (TCNI) (TCNI12 and newer), and the TCS Ni-alloys Mobility Database (MOBNI) (MOBNI6 and newer).
Configuration and Calculation Set Up
On the Scheil Calculator (renamed to Scheil with solute trapping) , the Scheil with solute trapping is used with these specific settings:
- Trans-interface diffusivity: Same for all elements
- Prefactor:
5.0E-9 - Maximum velocity for infinite driving force:
2000m/s - Model: Aziz
- Interface driving force: Driving energy
For the AM Calculator (renamed to AM Steady-state), the Steady-state calculation is configured as a Gaussian Heat Source with the Keyhole model and includes Fluid flow. It also uses a Single Point calculation with the Calculated Absorptivity.
On the Property Model Calculator (renamed to Columnar to Equiaxed Transition) a One Axis calculation for the FCC_L12 primary phase is done using the CET parameters entered on the Configuration window.
The settings on the Property Model Calculator include:
- Interfacial energy:
0.5J/m2. - Number of nucleation sites:
4.0E11/m3 - Nucleation undercooling :
4.0K - Equiaxed exponent:
3.13 - Solve for: Thermal gradient
- Equiaxed fractions:
0.01 0.49 0.99 - Solidification rate:
log10(v)
Visualizations
Open the example project file to review the node setup on the Project window and the associated settings on the Configuration window for each node. For some types of projects, you can also adjust settings on the Plot Renderer Configuration window to preview results before performing the simulation. Click Perform Tree to generate plots and tables to see the results on the Visualizations window.
There is a wide variety of information shown both in the Visualizations and Plot Renderer Configuration windows that can be viewed during configuration and after performing the calculation(s). Not all views, such as the Geometry or previews, nor all additional output (i.e. plots) are shown in this section and it is recommended that you open and run the example to review all available options and results.
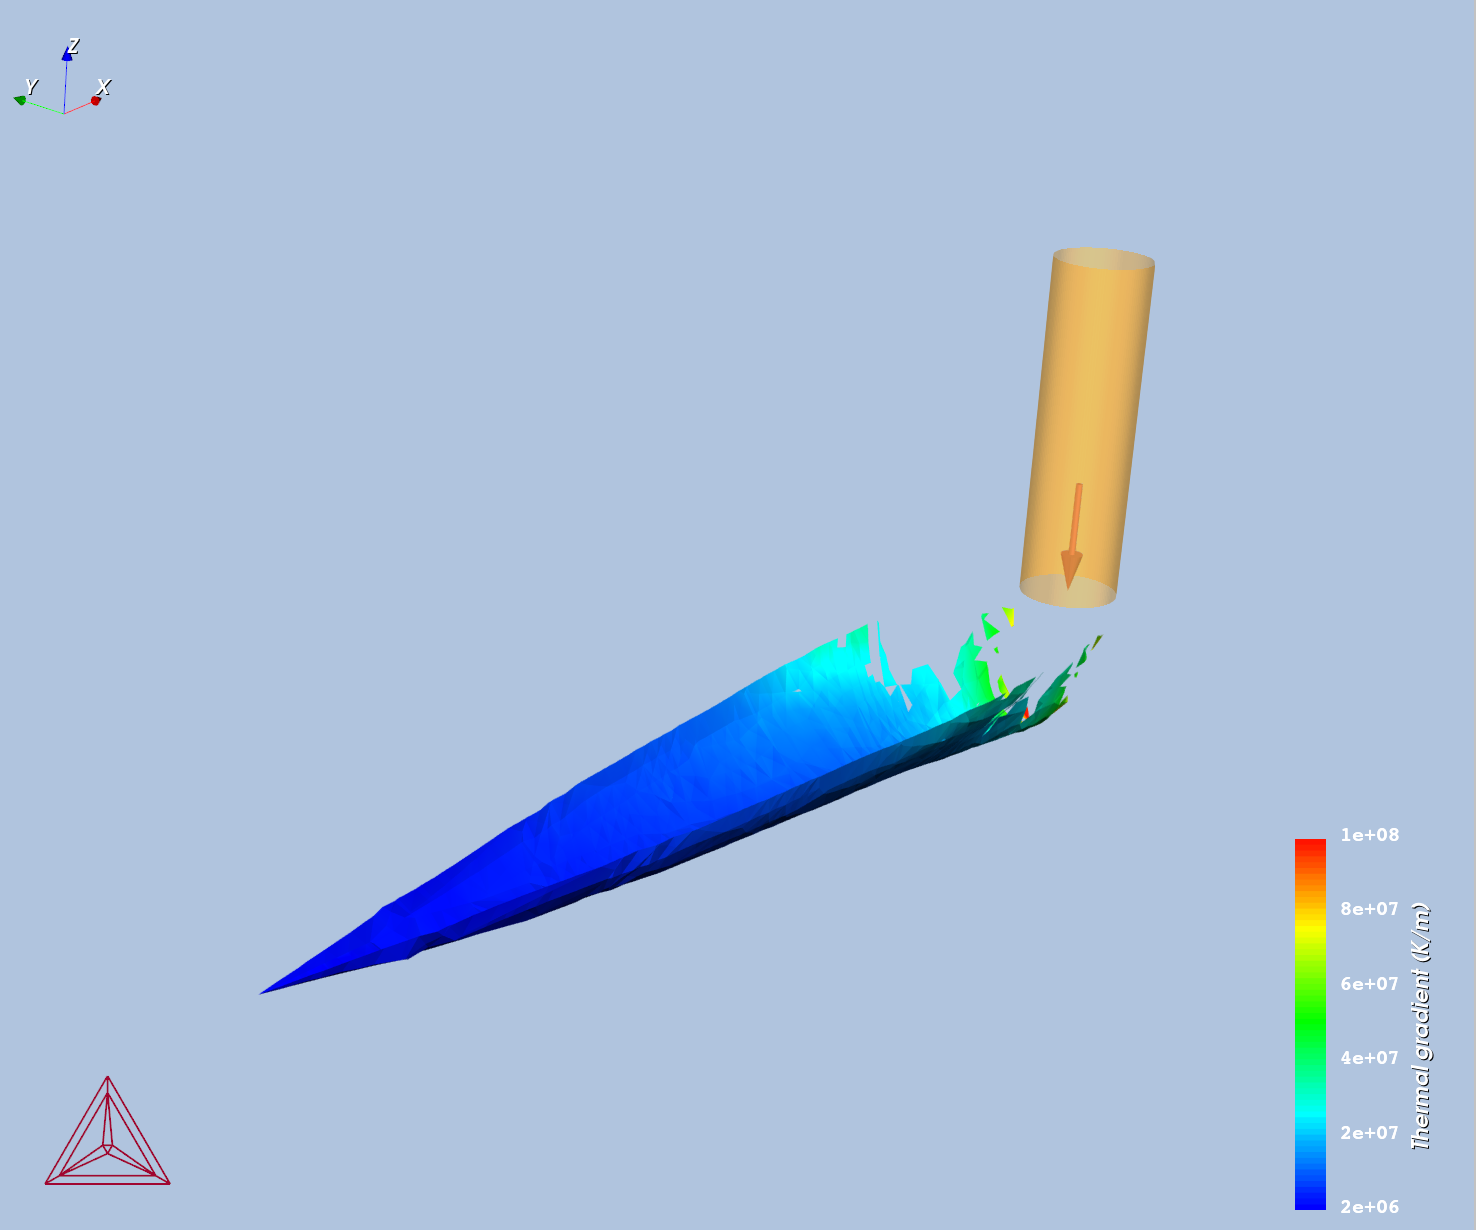
The thermal gradients and solidification rate can be visualized in 2D or 3D. Figure 1 shows the thermal gradient along the melt pool boundary in a 3D plot. Only the data corresponding to solidification conditions are shown. The thermal gradients corresponding to melting conditions are filtered out and only the tail part of the meltpool are shown.
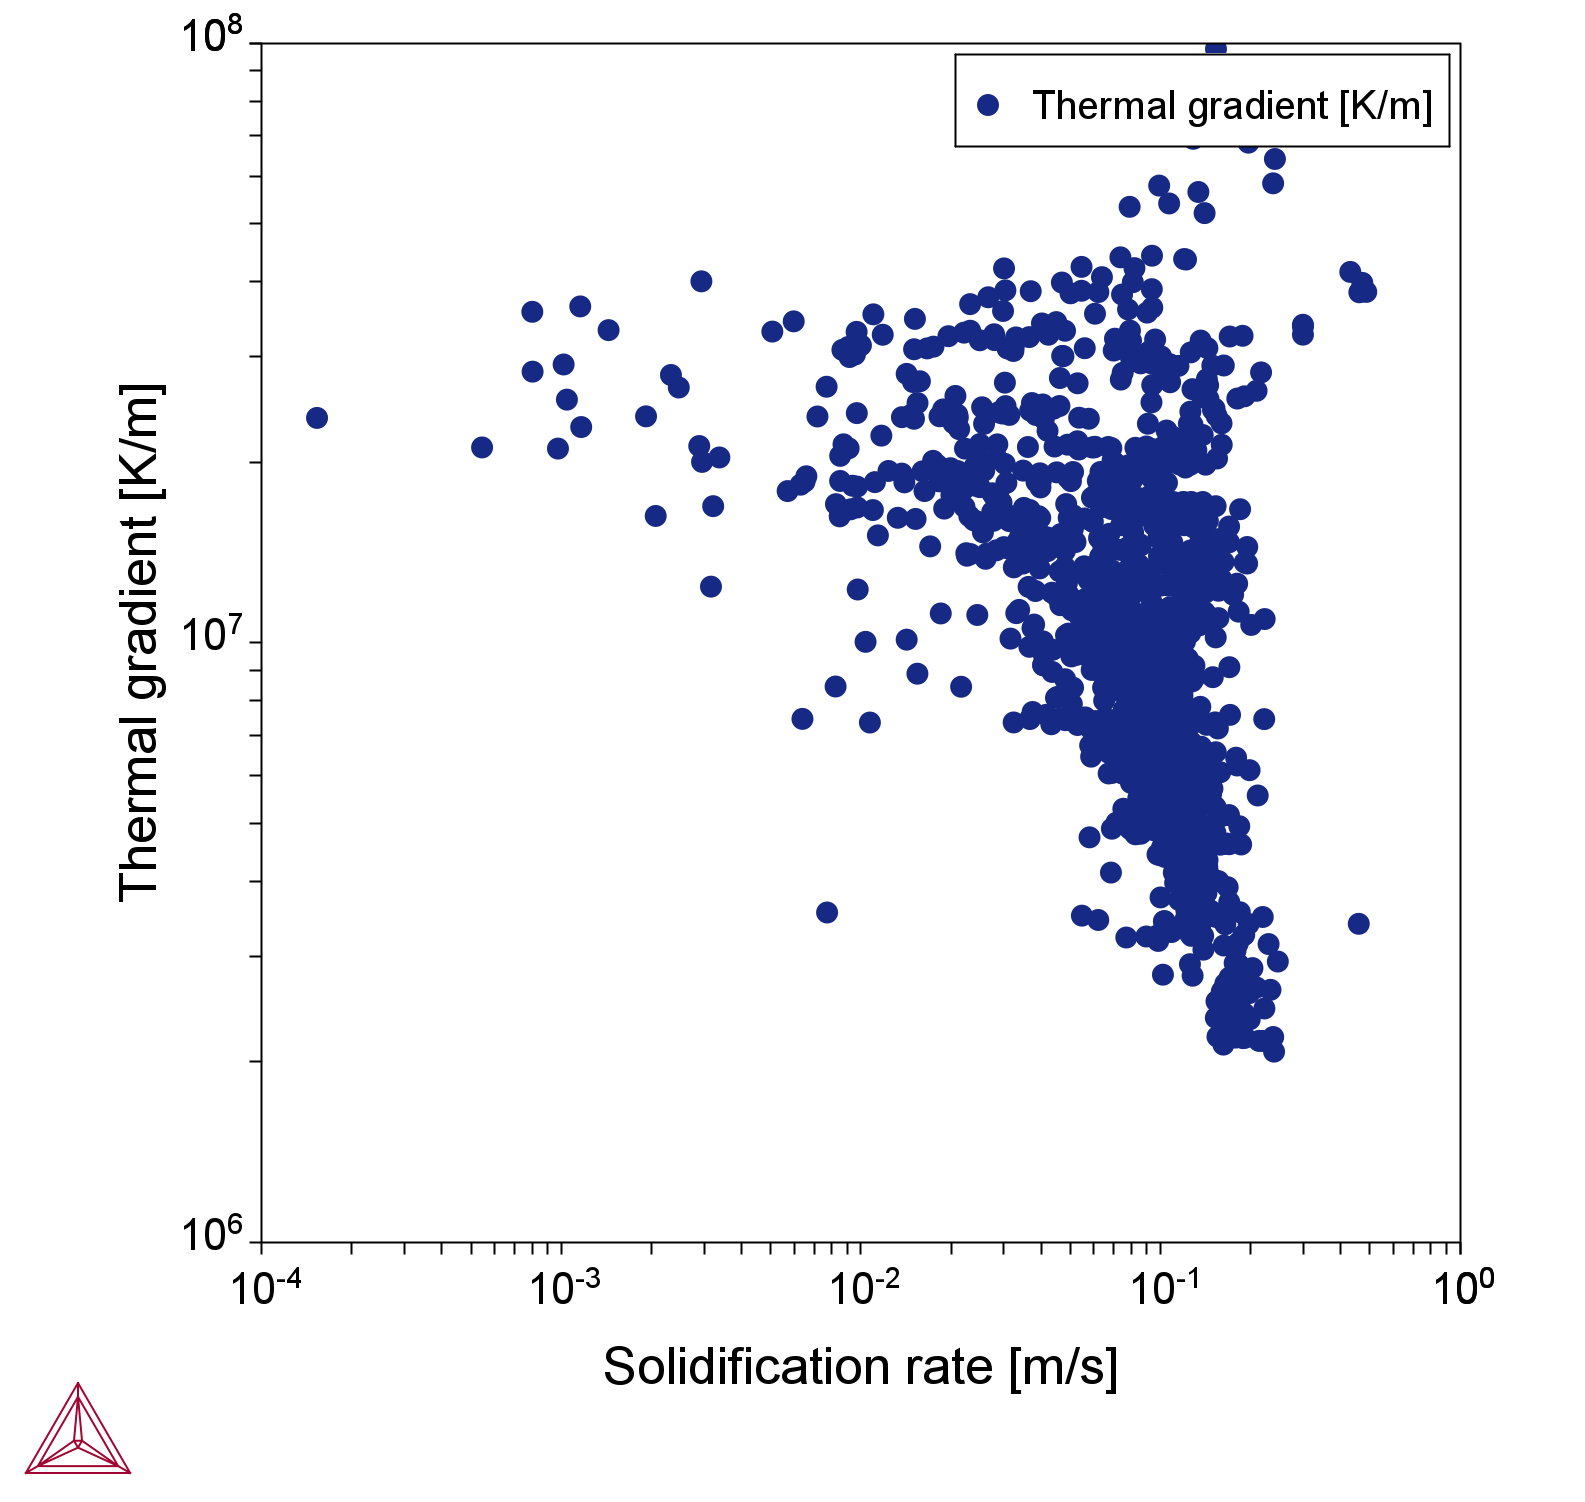
Both the thermal gradients and solidification rates from the melt pool can be visualized at the same time in a 2D scatter plot when the Plot Renderer tab Thermal Gradient vs Solidification Rate is selected.

Figure 2: The solidification rate vs thermal gradient is shown on the AM Thermal Gradient & Solidification Rate Plot Renderer.
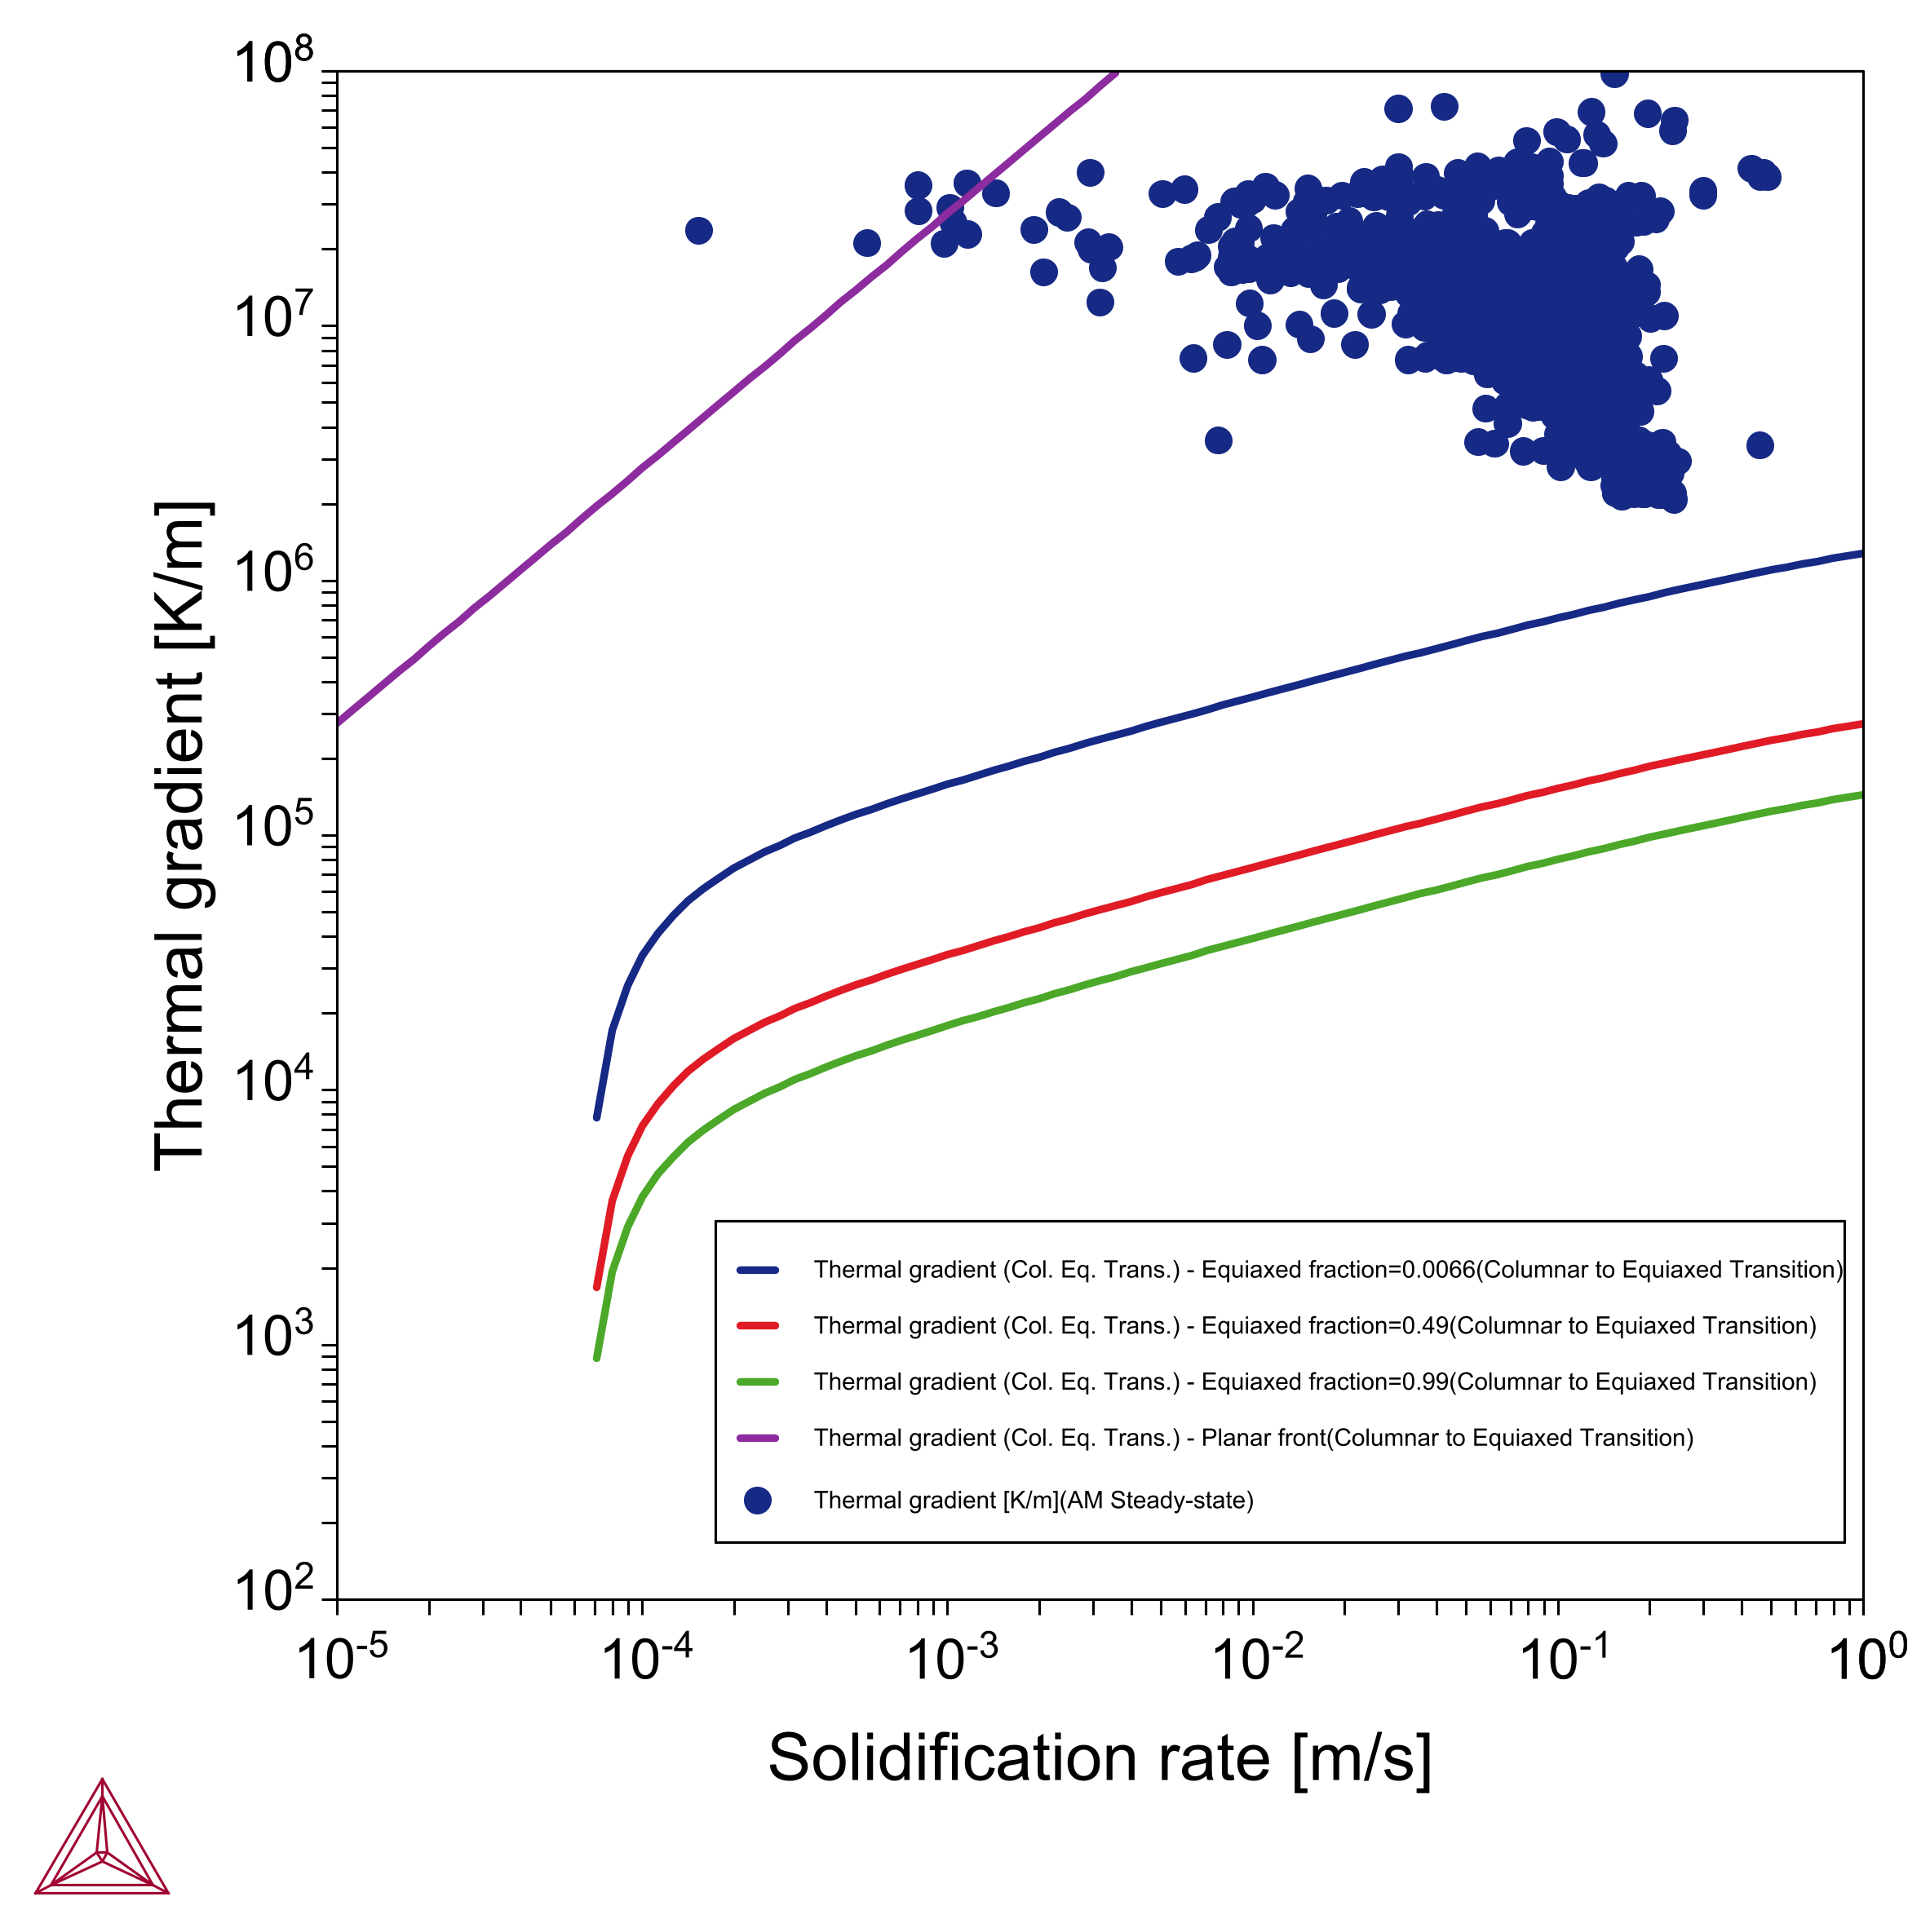
Figure 3 is an example of a plot where the results from both the AM simulation and the CET model for the IN718 thermal gradient vs solidification rate are overlaid on the same plot. The blue, red, and green lines show the increasing equiaxed fraction from the CET Property Model and the points show the solidification conditions at the melt pool calculated with the Additive Manufacturing (AM) Module. When the results are overlaid like this, you can see that nearly all the points (those below the purple line) exist in a fully columnar region.
Figure 3: The solidification rate vs the thermal gradient overlaying both plots from the AM Calculator and Property Model Calculator (via the AM + CET Plot Renderer).
Reference
[2020Pol] A. T. Polonsky, N. Raghavan, M. P. Echlin, M. M. Kirka, R. R. Dehoff, T. M. Pollock, 3D Characterization of the Columnar-to-Equiaxed Transition in Additively Manufactured Inconel 718, in Superalloys 2020 (2020), pp. 990–1002.
Other Resources
Read more about the Additive Manufacturing (AM) Module on our website including the details about database compatibility or to watch an introductory webinar. You can also use the Getting Started Guide to learn about the key features available.
Many of our Graphical Mode examples have video tutorials, which you can access in a variety of ways. When in Thermo‑Calc, from the menu select Help → Video Tutorials, or from the main My Project window, click Video Tutorials. Alternately, you can go to the website or our YouTube channel.


