D_08: Microsegregation During Solidification
This application example, which is available on our website, shows how Thermo-Calc together with the Diffusion Module (DICTRA) can be used to investigate and predict microsegregation (solute redistribution) during solidification.
The example is based on a real case where the elemental distribution of a continuously cast steel was measured revealing the concentration of the elements Si, Mn, and P as sketched in Figure 1. The profile results from the well-known segregation across secondary dendrite arms. The interesting point is that the elements Si and Mn show the expected positive segregation (higher concentrations) in the interdendritic regions. The peak of the P content, on the other hand, is shifted compared to Si and Mn, and, in fact, shows negative segregation in the interdendritic region. This is unexpected and counterintuitive.
The calculations are based on ones performed in the frame of a research project funded by the European Union called VESPISM – Virtual Experiments to Solve Problems in Metallurgy – conducted from 2001 to 2004.
- Folder: Diffusion Module - DICTRA
- File name:
D_08_Diffusion_Microsegregation_During_Solidification.tcu
Running this calculation requires licenses for the Add-on Diffusion Module (DICTRA) plus the steels thermodynamic database (TCFE) and mobility database (MOBFE). For best results, TCFE14 and MOBFE8.1 and newer (as of 2025a) are recommended.
Visualizations
Many of our Graphical Mode examples have video tutorials, which you can access in a variety of ways. When in Thermo‑Calc, from the menu select Help → Video Tutorials, or from the main My Project window, click Video Tutorials. Alternately, you can go to the website or our YouTube channel.
Open the example project file to review the node setup on the Project window and the associated settings on the Configuration window for each node. For some types of projects, you can also adjust settings on the Plot Renderer Configuration window to preview results before performing the simulation. Click Perform Tree to generate plots and tables to see the results on the Visualizations window.
When you run (Perform) this example, it takes a few minutes for the calculations to complete.
There is a variety of information shown in the Visualizations window that can be viewed during configuration and after performing the calculation.
- Composition Profiles and Thermal Profile: When setting up a calculator on a Configuration window you can preview the profile and adjust settings as needed. When you click a calculator node in the Project window, the matching name of the node is on the tab(s) displayed in the Visualizations window.
- Plot or Table results: After completing the set up and performing the calculation, to view the matching name of the node on tab(s) in the Visualizations window, either click a Plot Renderer or Table Renderer node in the Project window or click the tabs individually in the Visualizations window.
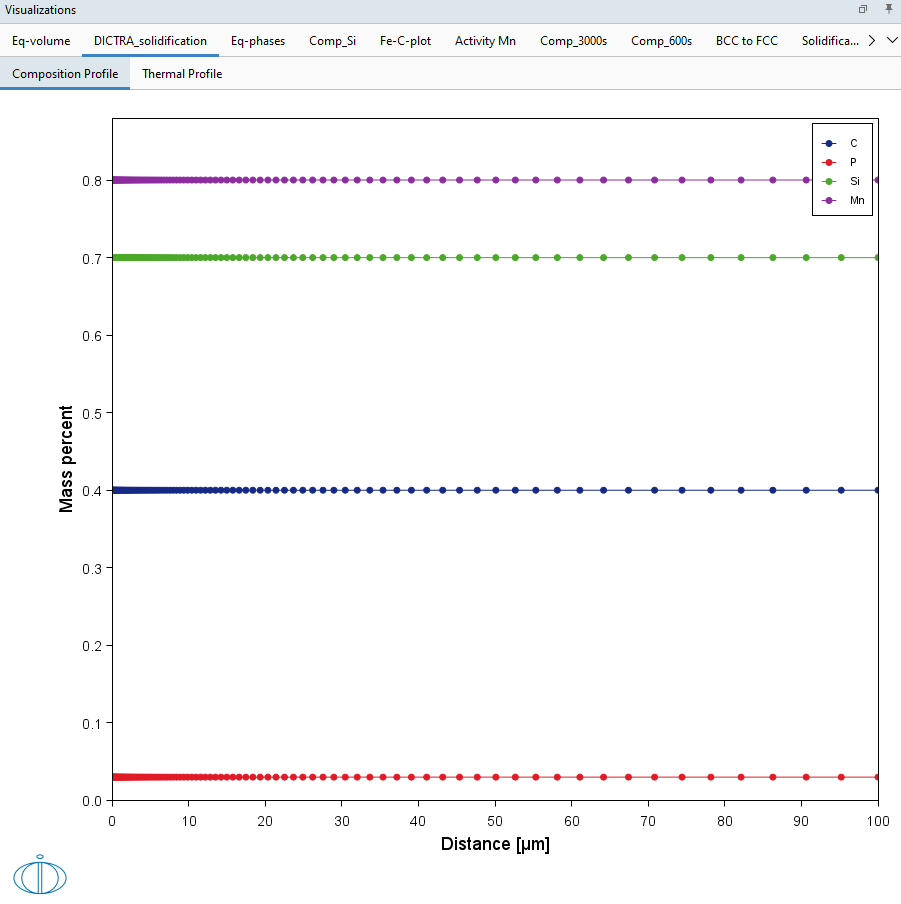
Figure 1: During set up of the calculation, you can preview the Composition Profile. Click the tab in the Visualizations window to switch between these previews and adjust settings on the Diffusion Calculator Configuration window.
The other resulting plots and details related to setting up this example are available to download via the dedicated web page.
