D_10: Iron (Fe) Homogenization in Scheil
This example models the homogenization of a cast Ni-Cr steel and compares predictions with the experimental data collated by Fuchs and Roósz [1975Fuc]. The conditions studied have a dendritic half spacing of 200 µm and are heat treated to temperatures of 1120 °C and 1235 °C. The data has been un-normalized to allow comparison using wt.% composition values.
The composition of the steel is 0.4C, 0.65Mn, 0.35Si, 0.015S, 0.01P, 1.9Ni, 0.95Cr, and 0.3 Mo (wt.%). The diffusion of Cr and Ni are modeled using a simplified chemistry of 0.4C, 0.65Mn, 1.9Ni, and 0.95Cr.
- Folder: Diffusion Module - DICTRA
- File name:
D_10_Fe _Homogenization_from_Scheil.tcu
The Diffusion Module (DICTRA) Console Mode example exa7 is available to show the use of Scheil segregation profiles in Console Mode.
The FEDEMO thermodynamic and MFEDEMO mobility databases are used with this example. Users with a Diffusion Module (DICTRA) license can run the example. Other users can read the documentation as a DEMO license only allows the use of up to three components.
Visualizations
Many of our Graphical Mode examples have video tutorials, which you can access in a variety of ways. When in Thermo‑Calc, from the menu select Help → Video Tutorials, or from the main My Project window, click Video Tutorials. Alternately, you can go to the website or our YouTube channel.
Open the example project file to review the node setup on the Project window and the associated settings on the Configuration window for each node. For some types of projects, you can also adjust settings on the Plot Renderer Configuration window to preview results before performing the simulation. Click Perform Tree to generate plots and tables to see the results on the Visualizations window.
There is a variety of information shown in the Visualizations window that can be viewed during configuration and after performing the calculation.
- Composition Profiles and Thermal Profile: When setting up a calculator on a Configuration window you can preview the profile and adjust settings as needed. When you click a calculator node in the Project window, the matching name of the node is on the tab(s) displayed in the Visualizations window.
- Plot or Table results: After completing the set up and performing the calculation, to view the matching name of the node on tab(s) in the Visualizations window, either click a Plot Renderer or Table Renderer node in the Project window or click the tabs individually in the Visualizations window.
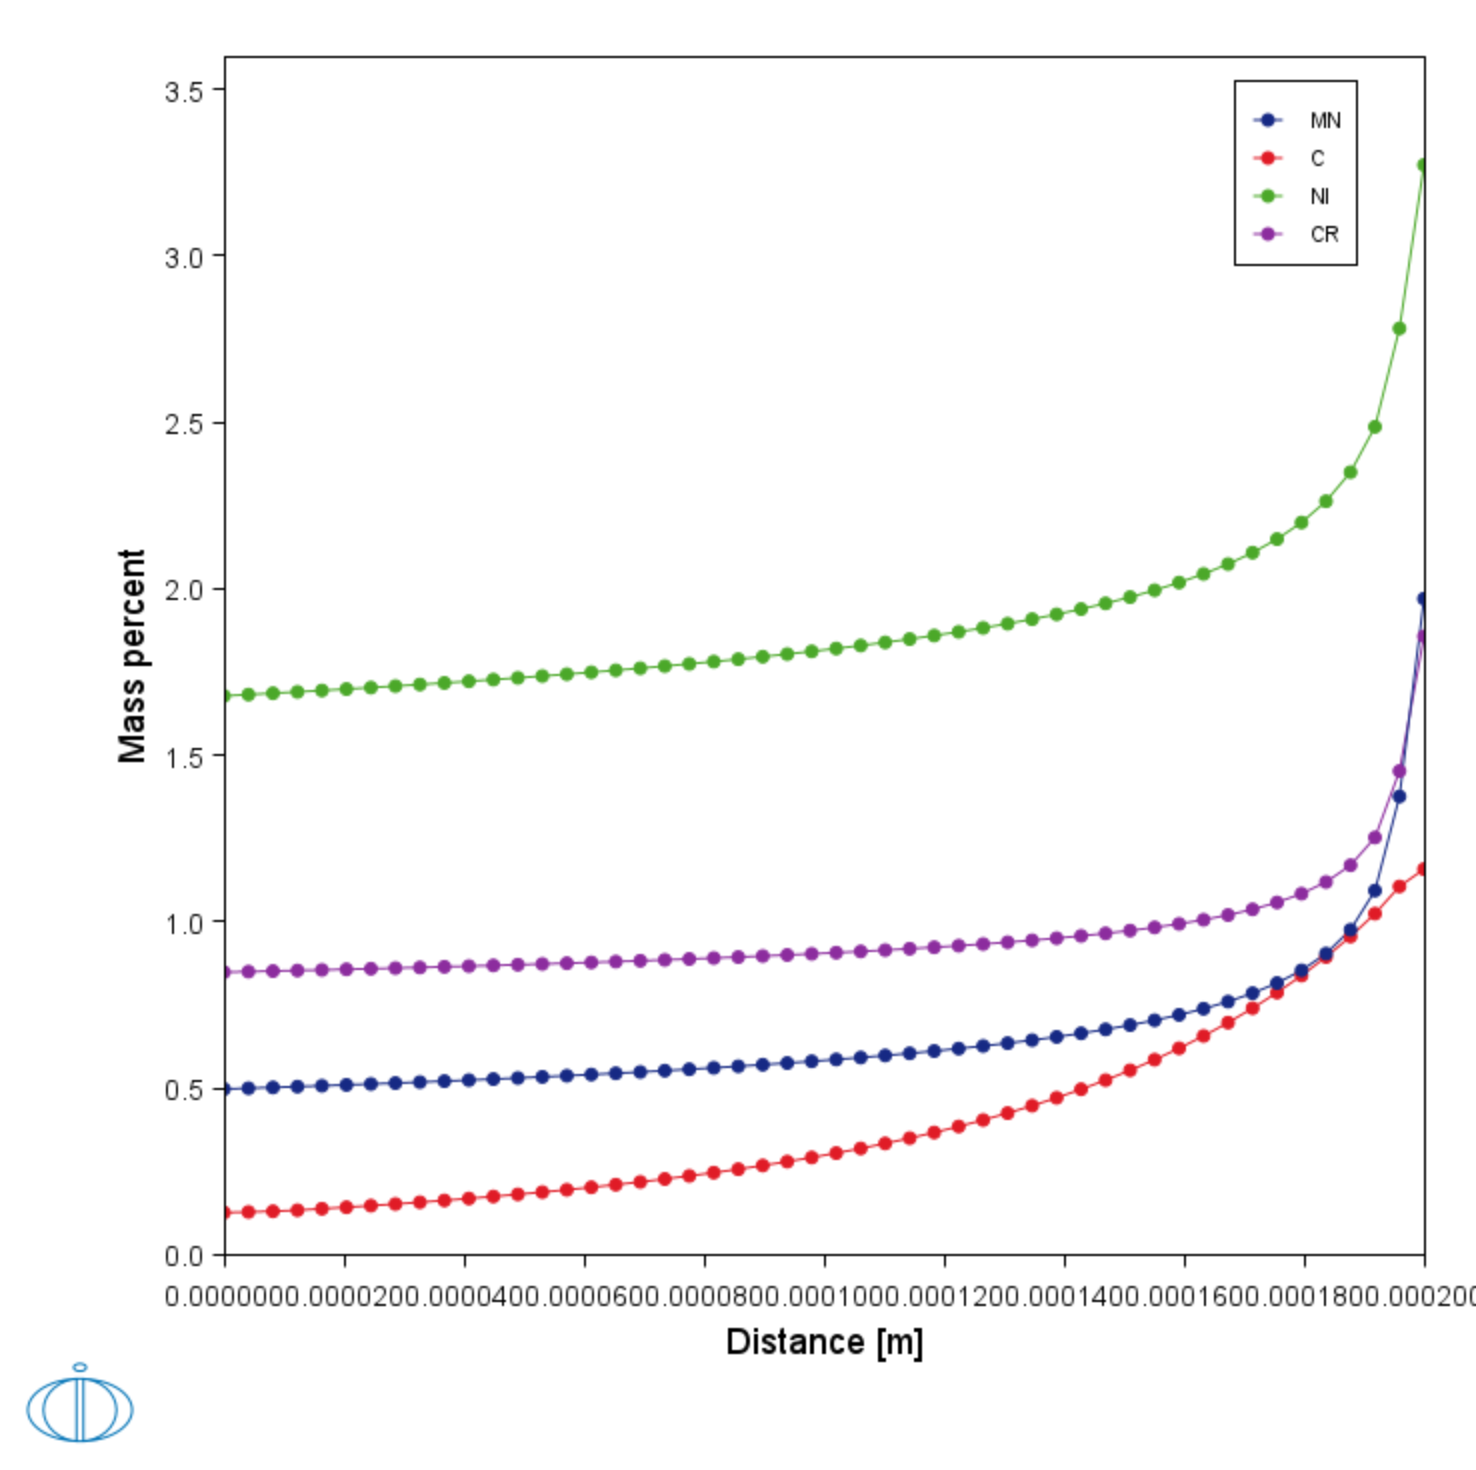
Figure 1: The predicted chemical segregation using the Scheil calculation, with a dendritic half spacing of 200 µm. This is the Composition Profile that is set up on the Diffusion Calculator and then previewed in the Visualizations window.
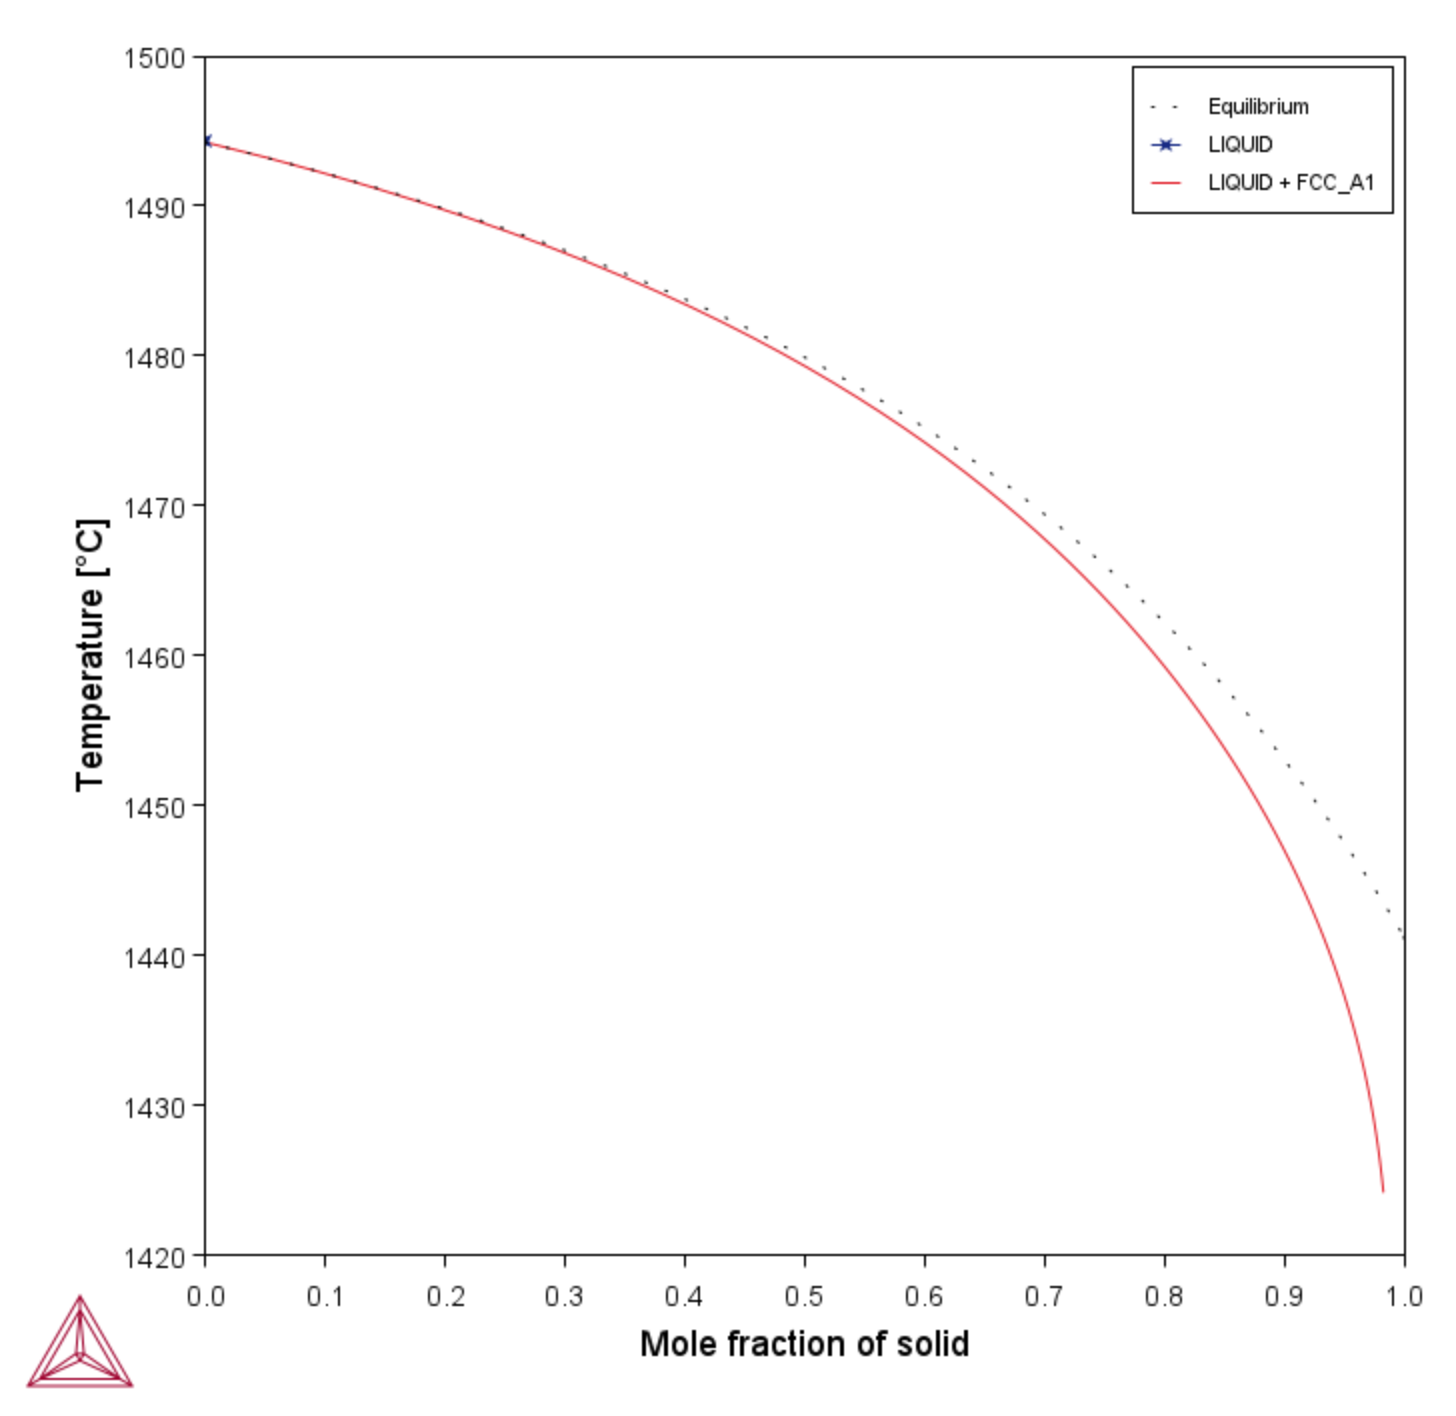
Figure 2: The solidification behavior predicted from the Scheil calculation compared with the equilibrium solid fraction.
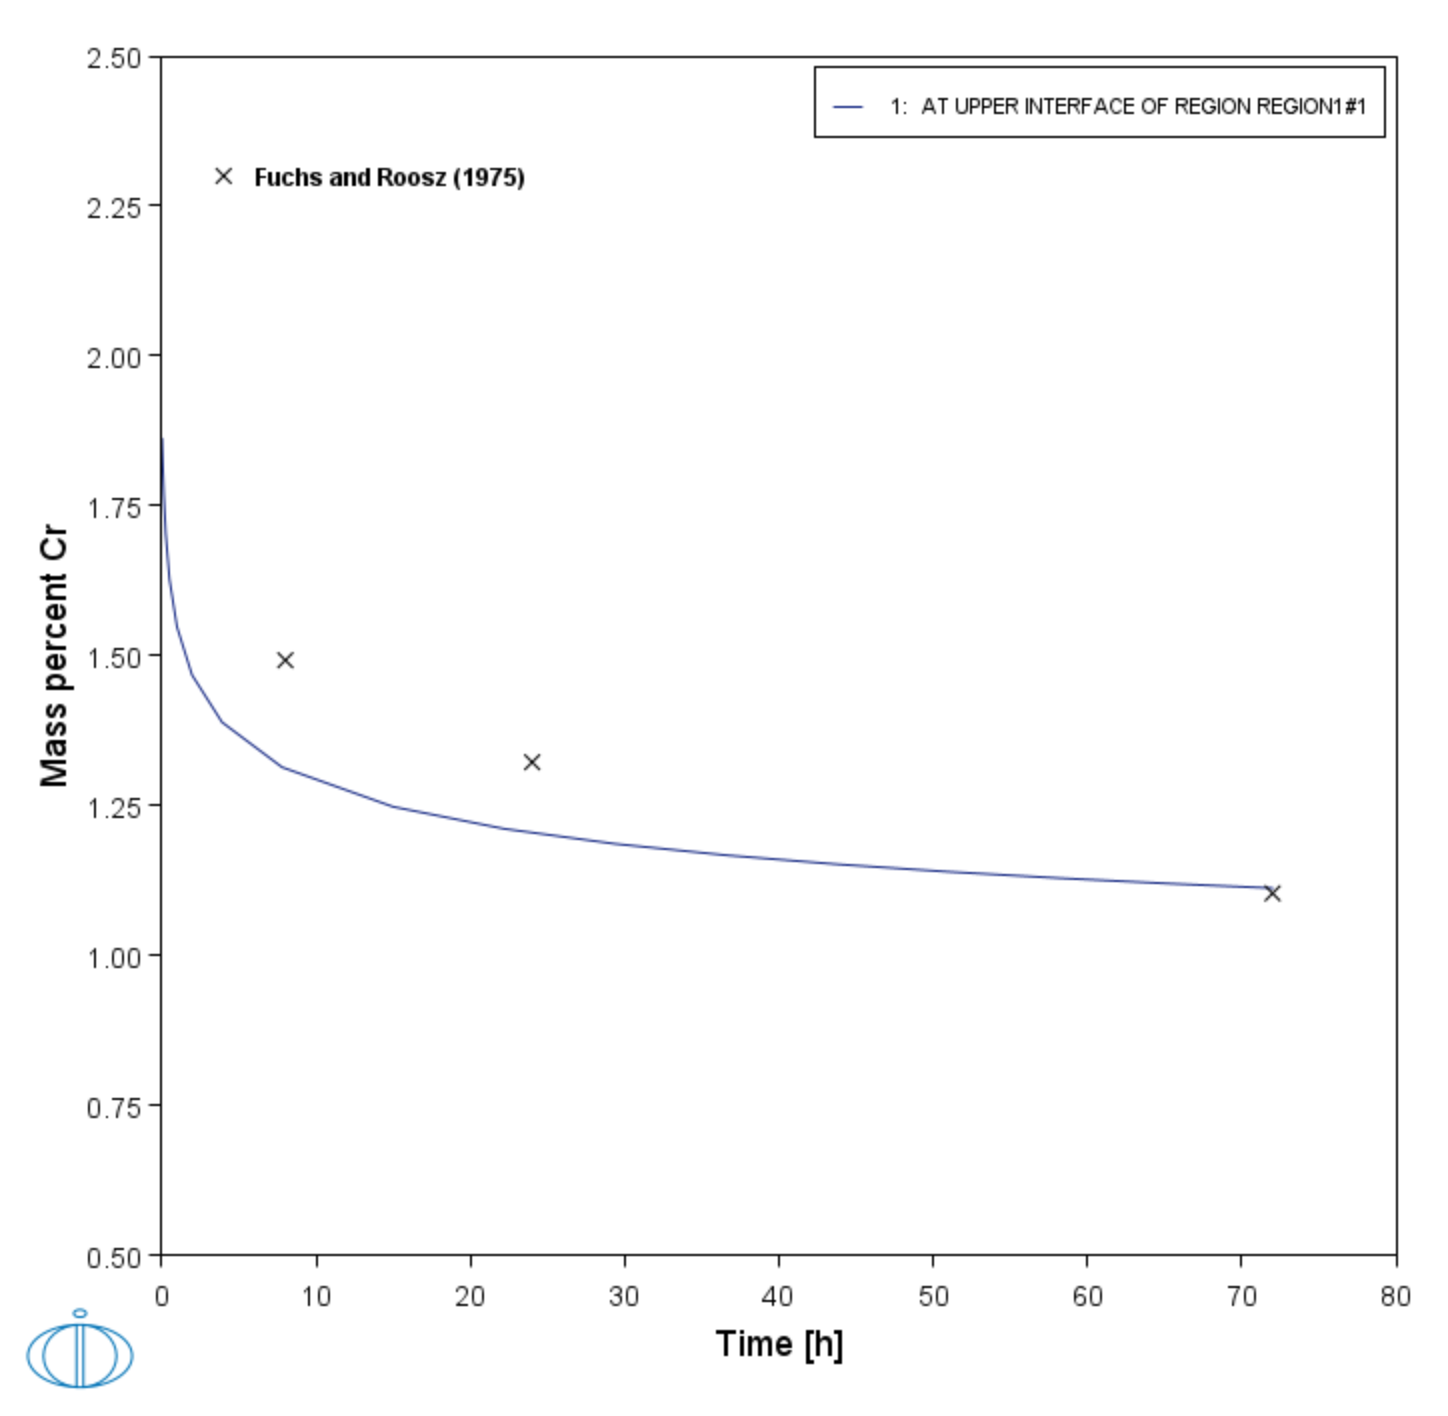
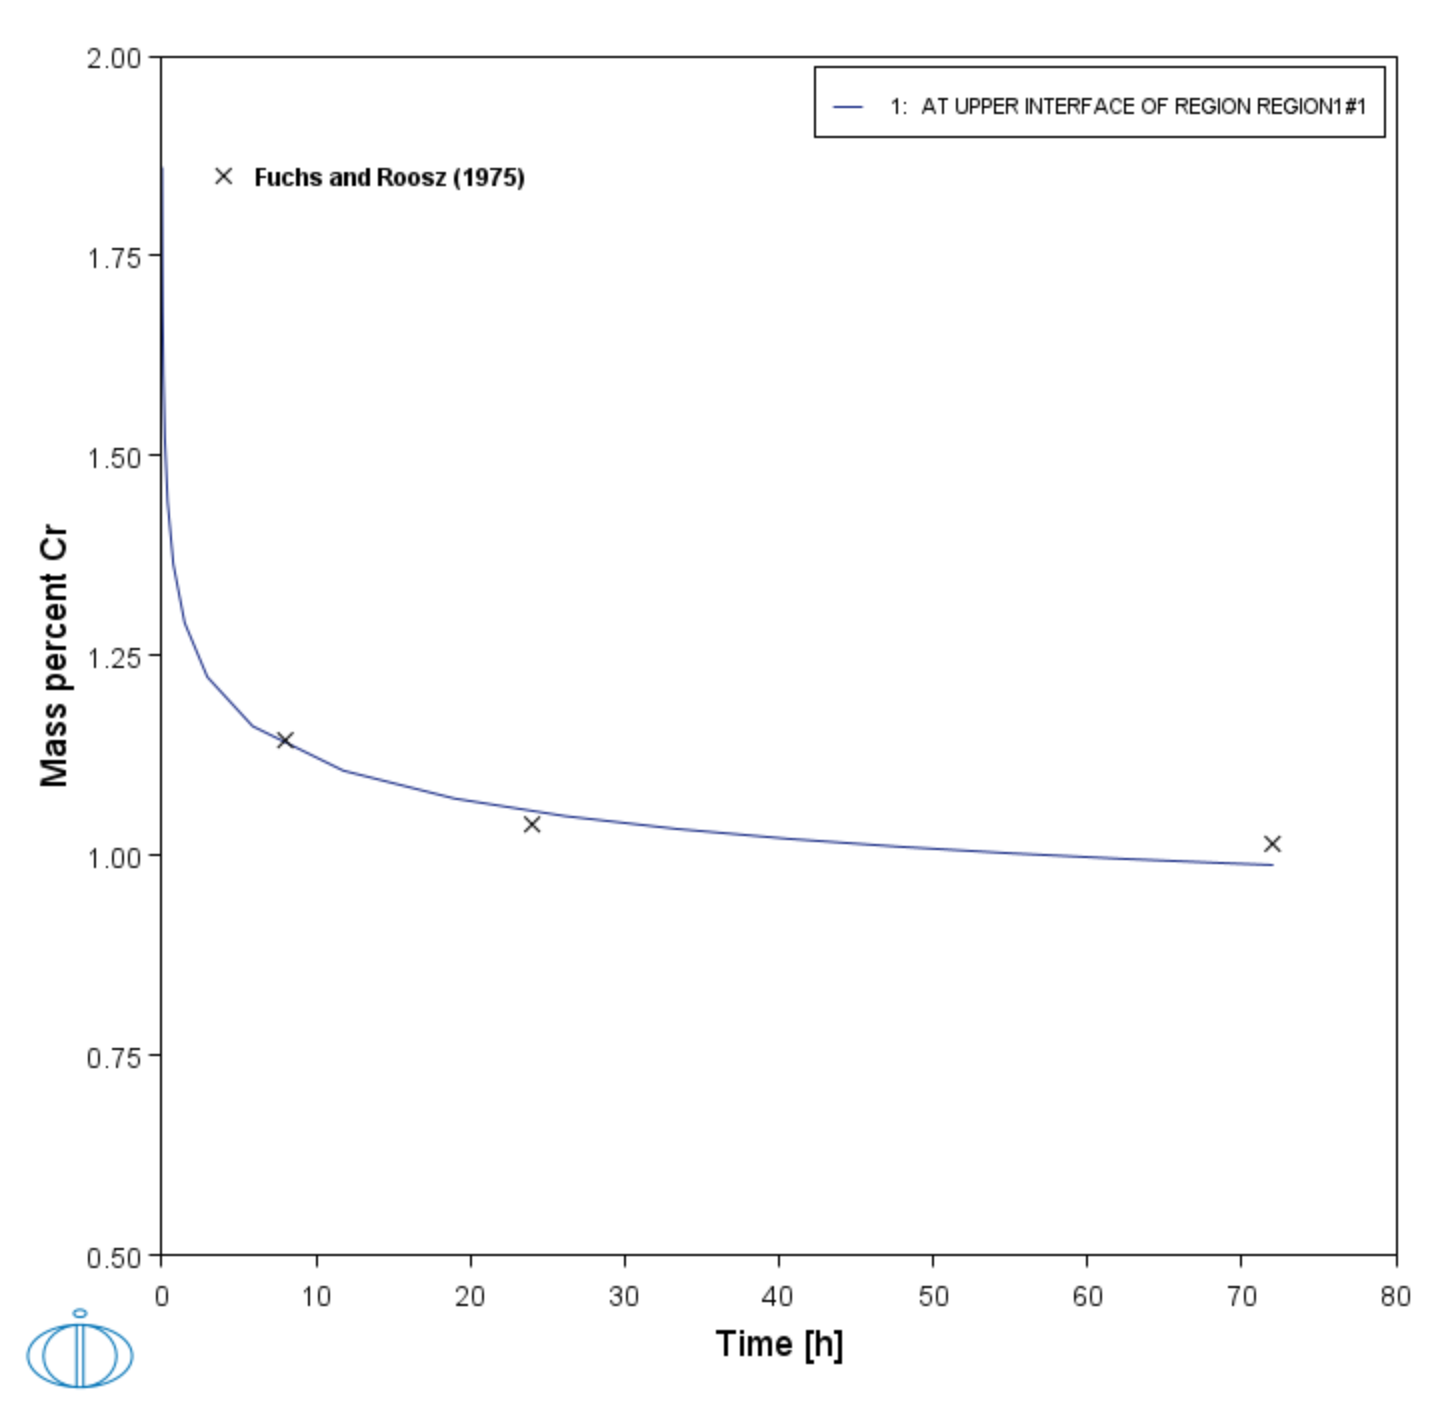
Figure 3: A comparison of the predicted and measured maximum Cr across the dendrites during homogenization at 1120 °C.
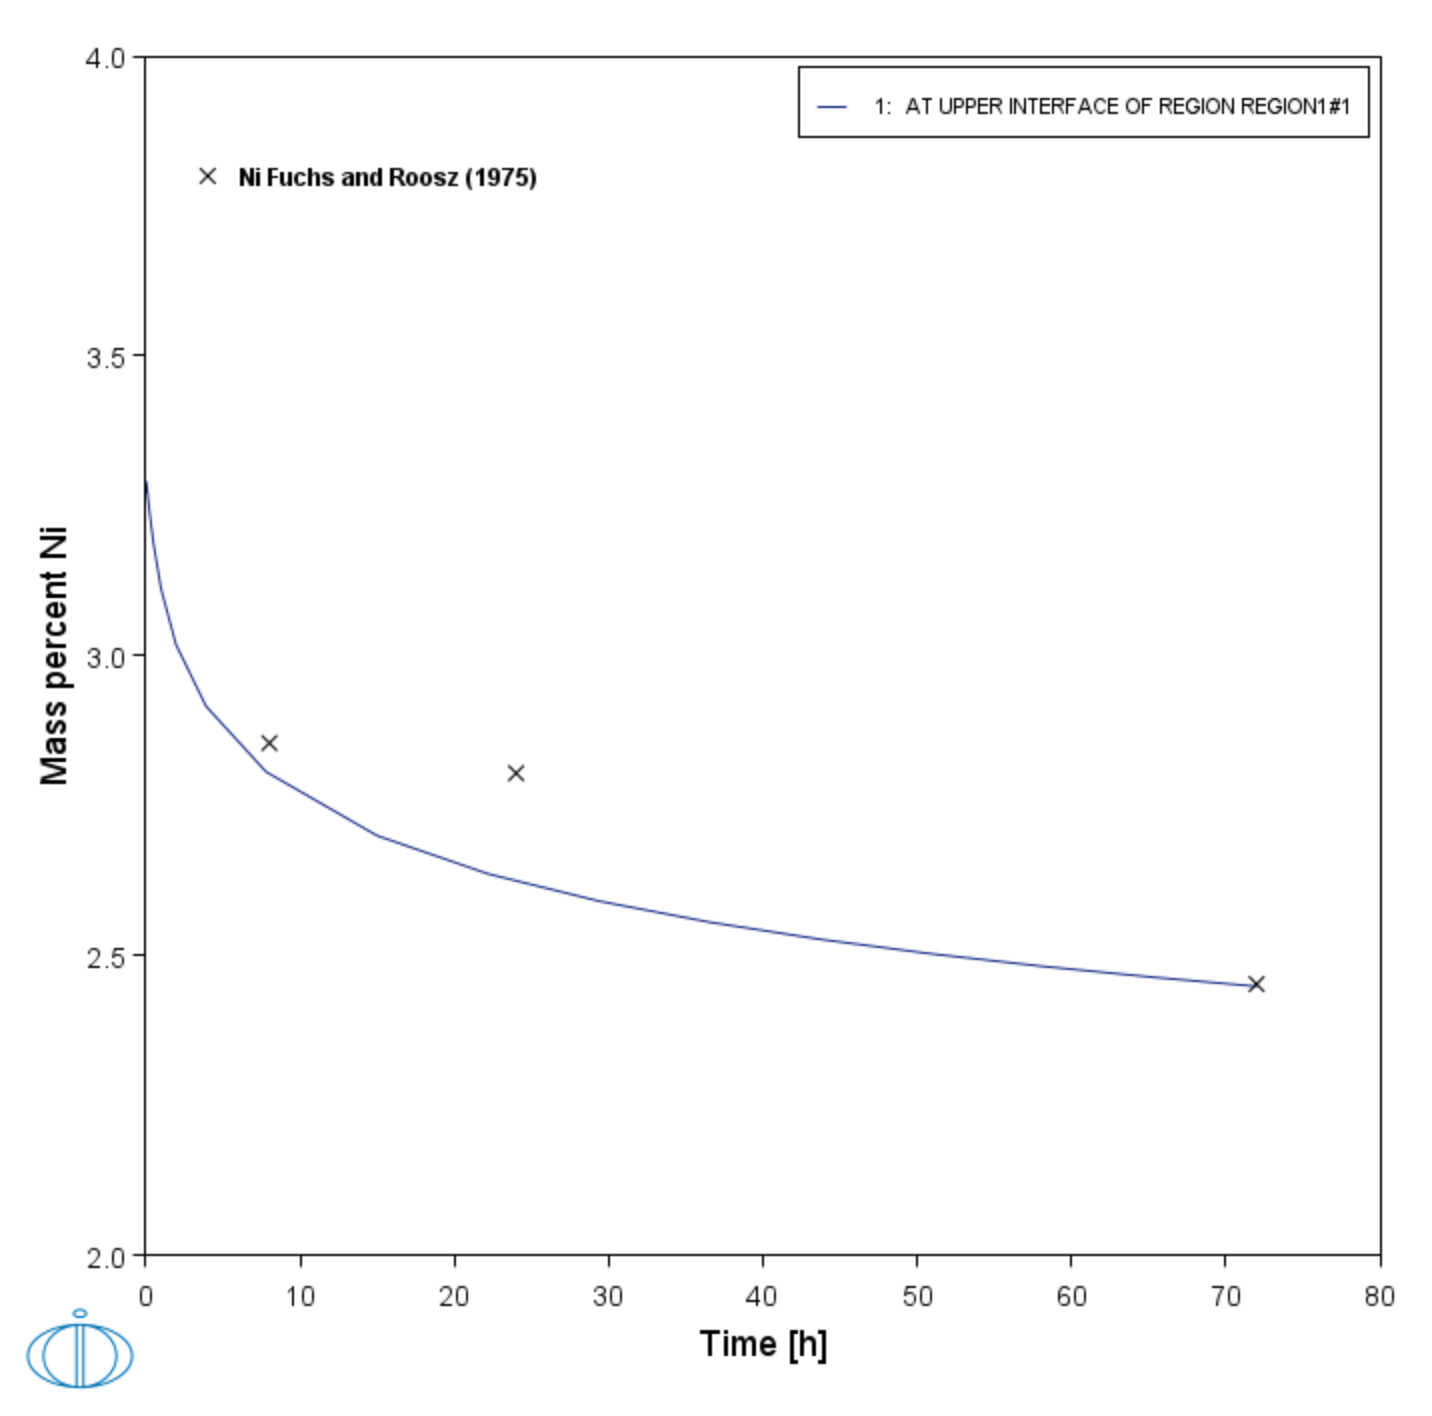
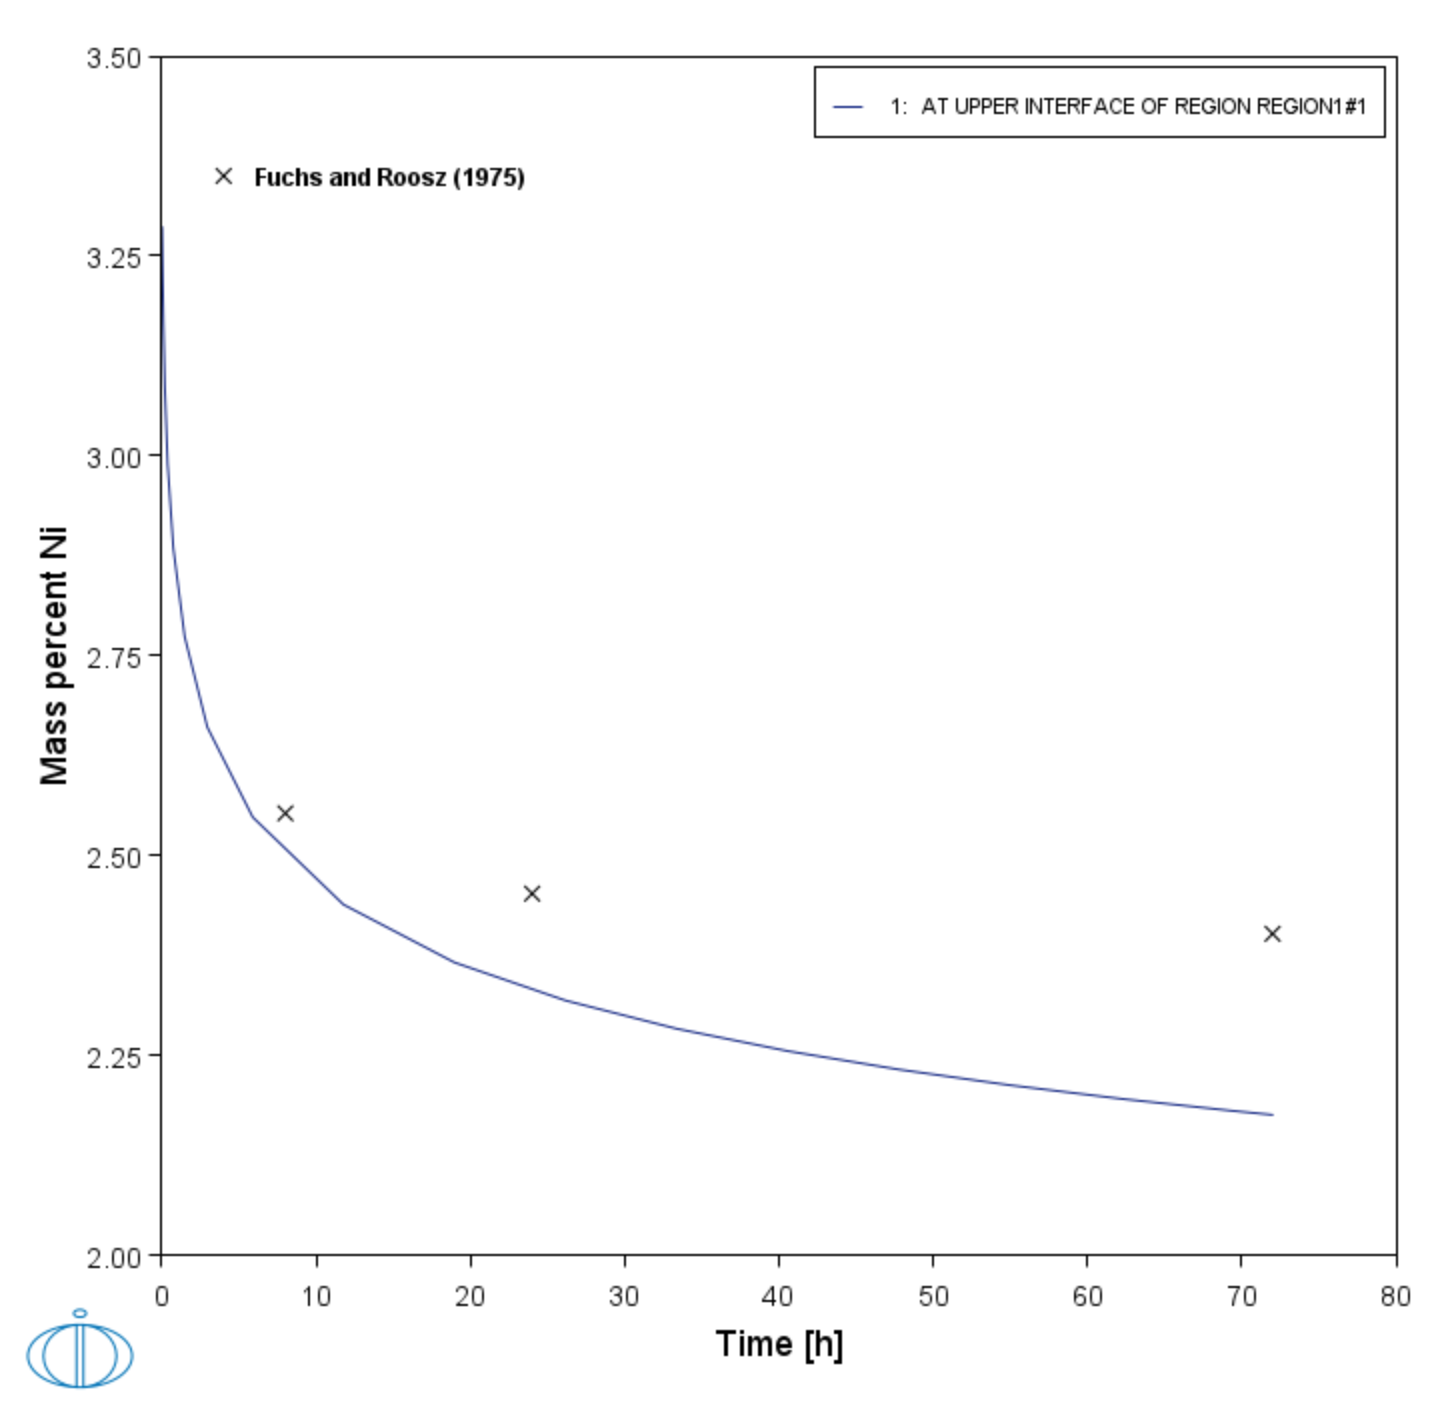
Figure 4: A comparison of the predicted and measured maximum Ni across the dendrites during homogenization at 1120 °C.
Figure 5: A comparison of the predicted and measured maximum Cr across the dendrites during homogenization at 1235 °C.
Figure 6: A comparison of the predicted and measured maximum Ni across the dendrites during homogenization at 1235 °C.
Reference
[1975Fuc] E. G. Fuchs, A. Roósz, Homogenization of Iron-Base Cast Alloys. Met. Sci. 9, 111–118 (1975).
