Plot Type: Heat Map, Contour, and 3D
The Plot Renderer is a dynamic activity node with options such as being able to choose from a variety of Plot types based on the Calculator and Calculation Type selected.
Calculation Types in Graphical Mode
See Plot Types detailing availability By Calculator, By Plot Type, or By Calculation Type.
Visit the website Application Examples → Process Metallurgy for examples of these Plot types using the Process Metallurgy Calculator.
Heat Map
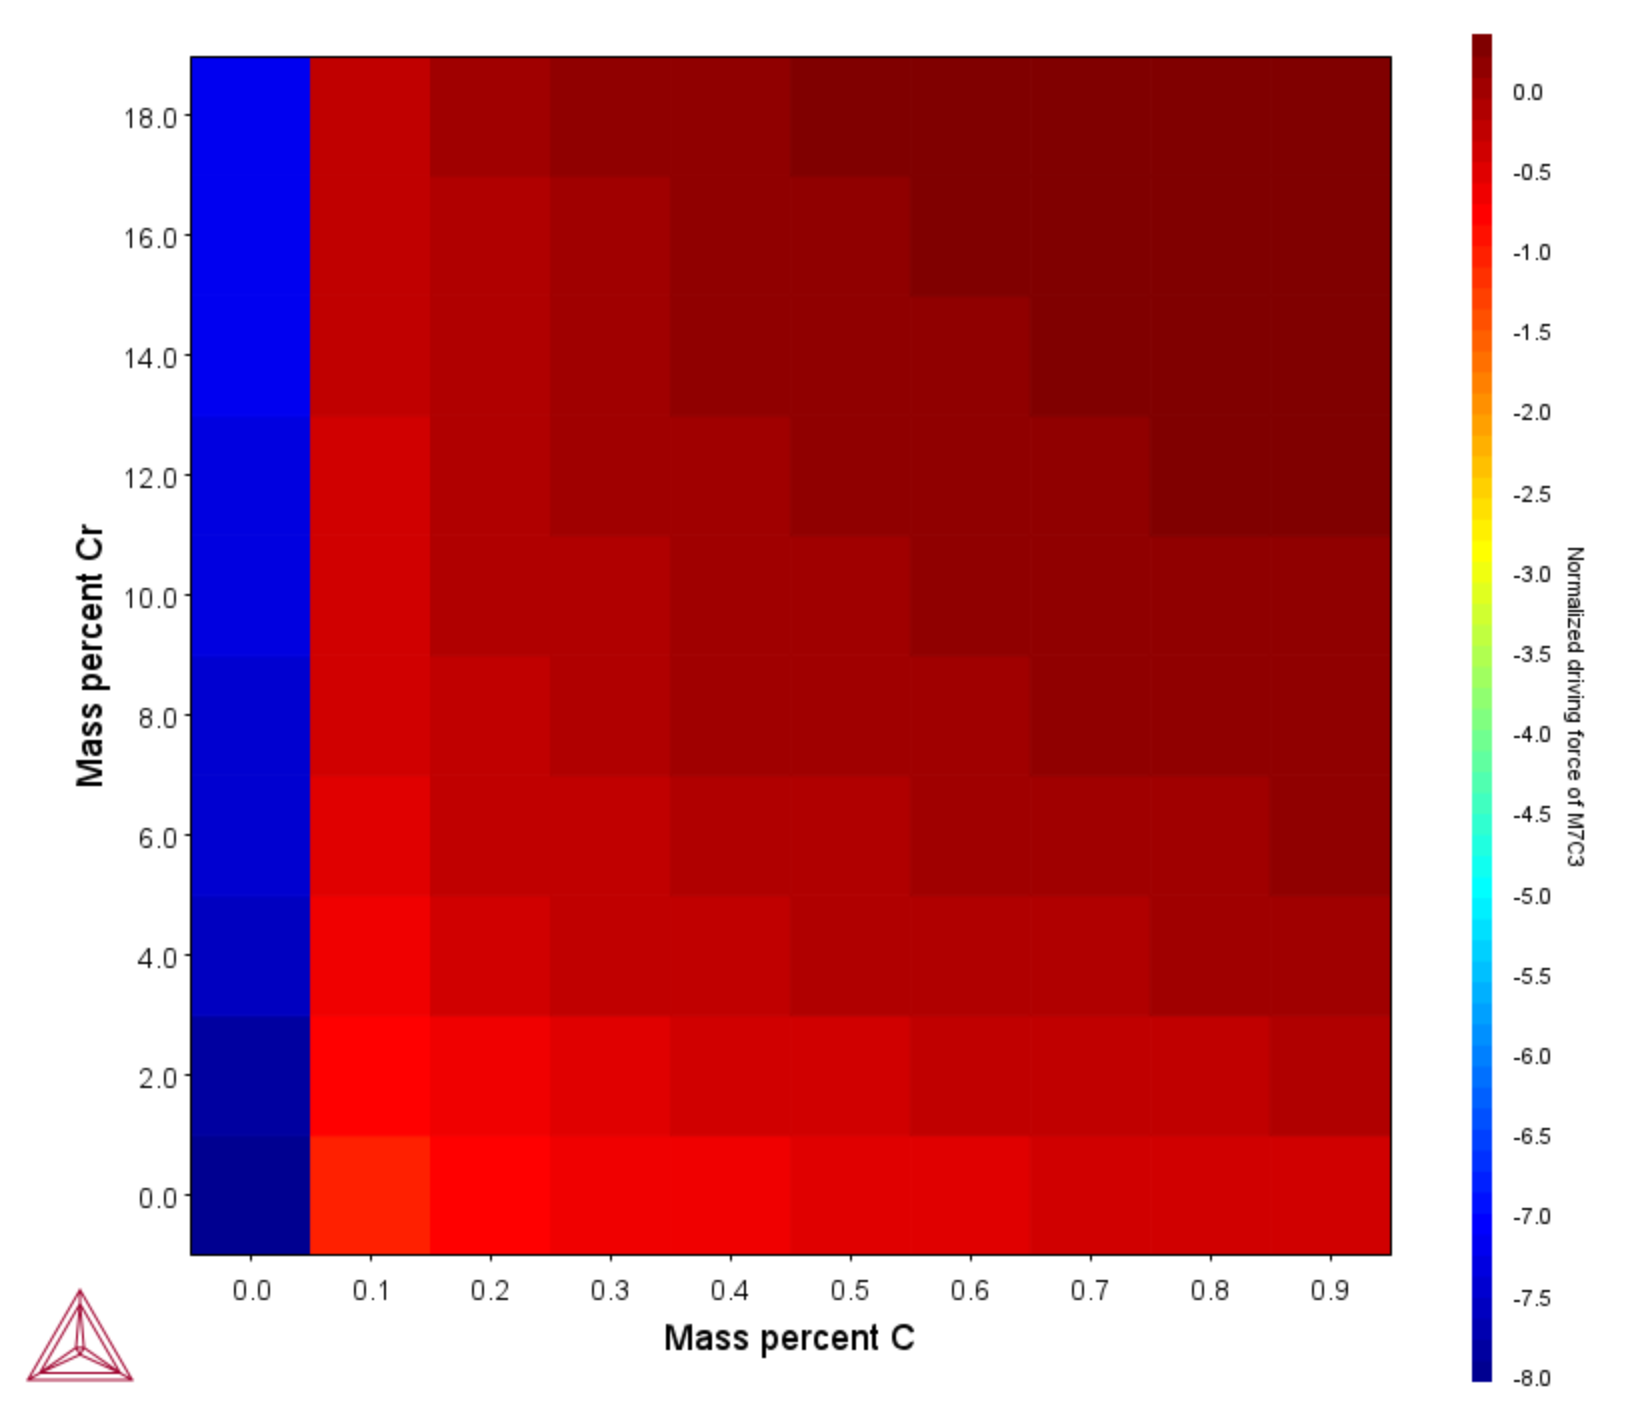
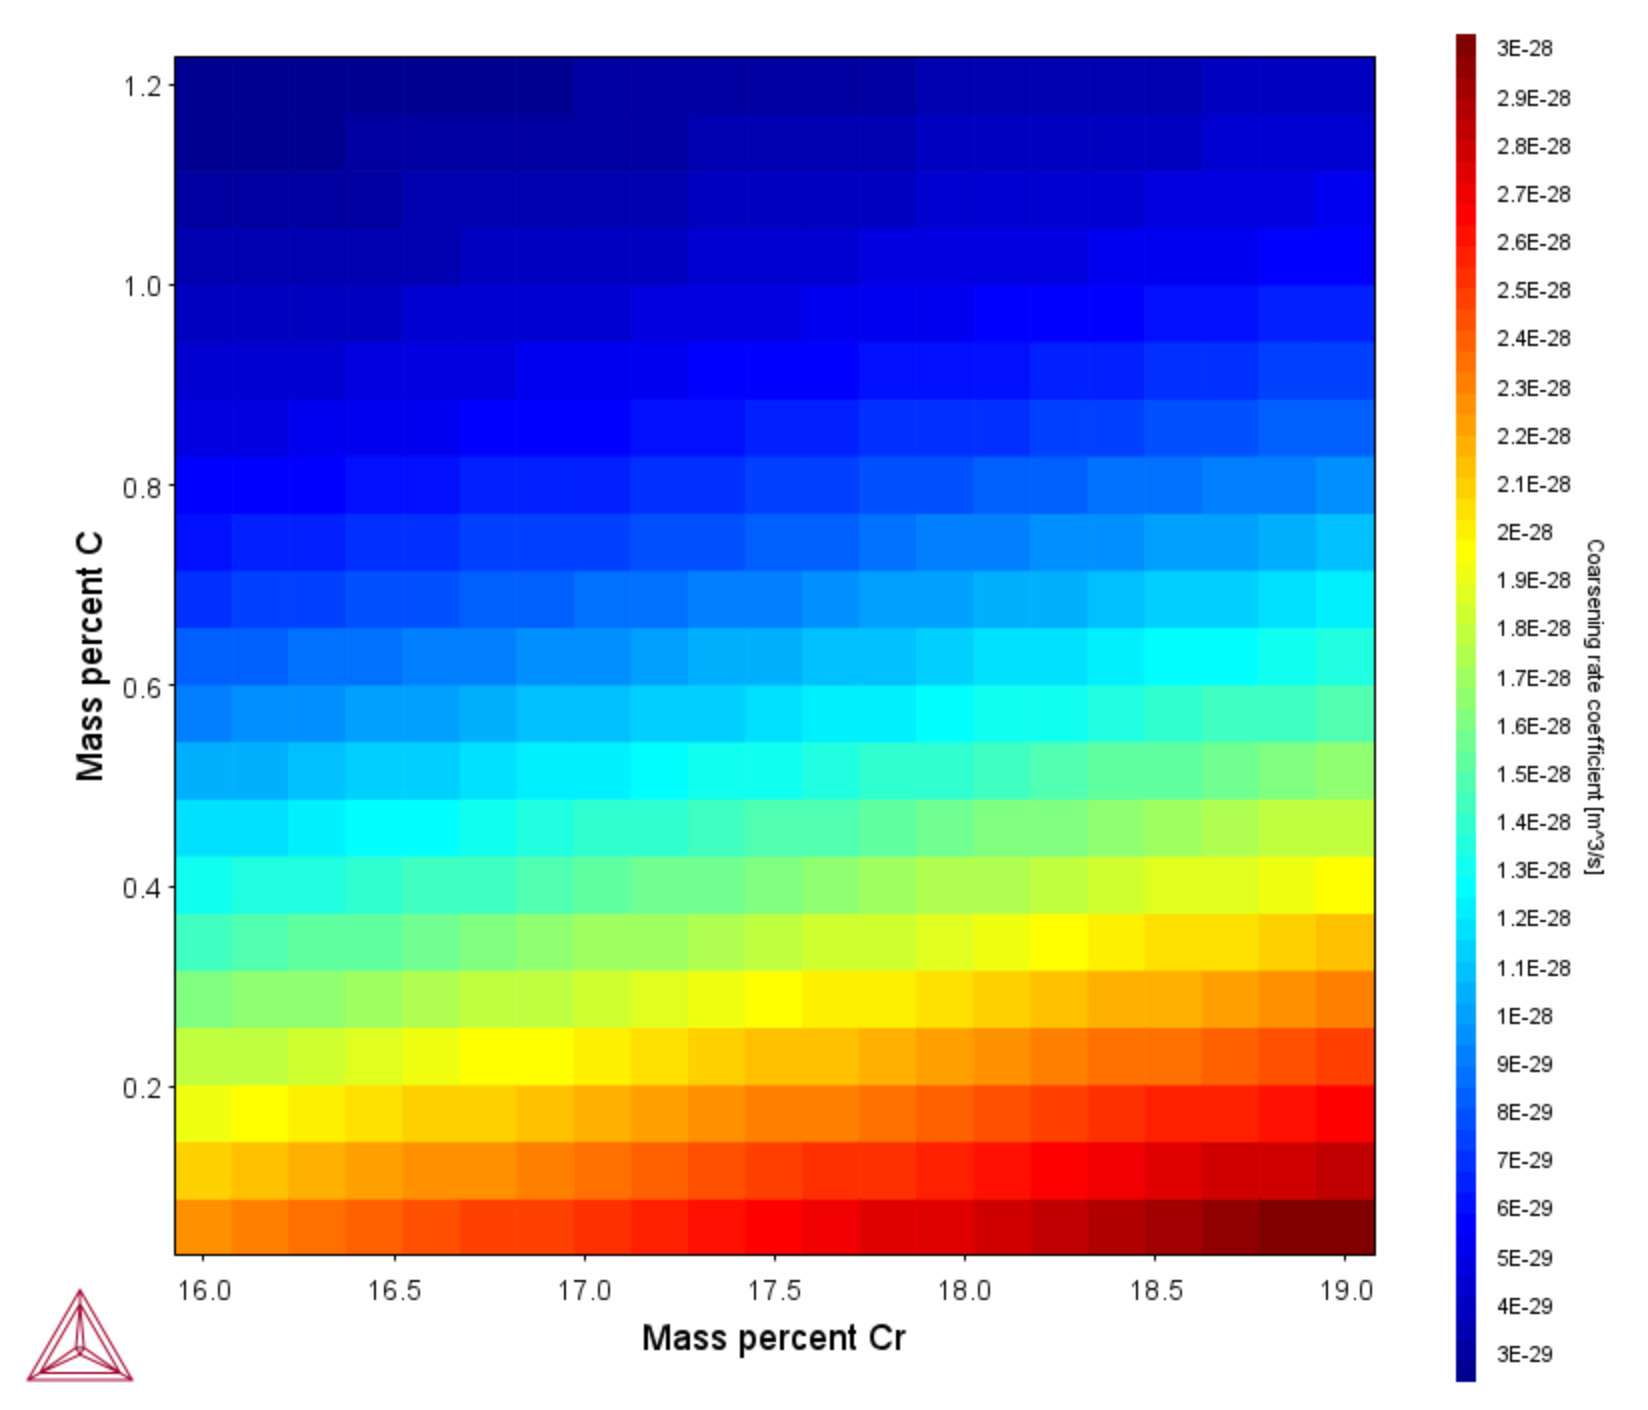
For a Heat map plot, each Z-axis variable value in the grid is represented by a color-coded area, where dark red represents the highest Z-axis variable value and dark blue represents the lowest Z-axis variable value.
Thermo-Calc example T_09 uses an Equilibrium Calculator with a Grid Calculation Type to generate a Heat map plot.
T_09: Carbide Driving Force Heat Map
Thermo-Calc General Property Model example PM_G_02 uses a Property Model Calculator with a Grid Calculation type to plot the coarsening rate coefficient as a Heat map.
PM_G_02: Coarsening and Interfacial Energy
Contour
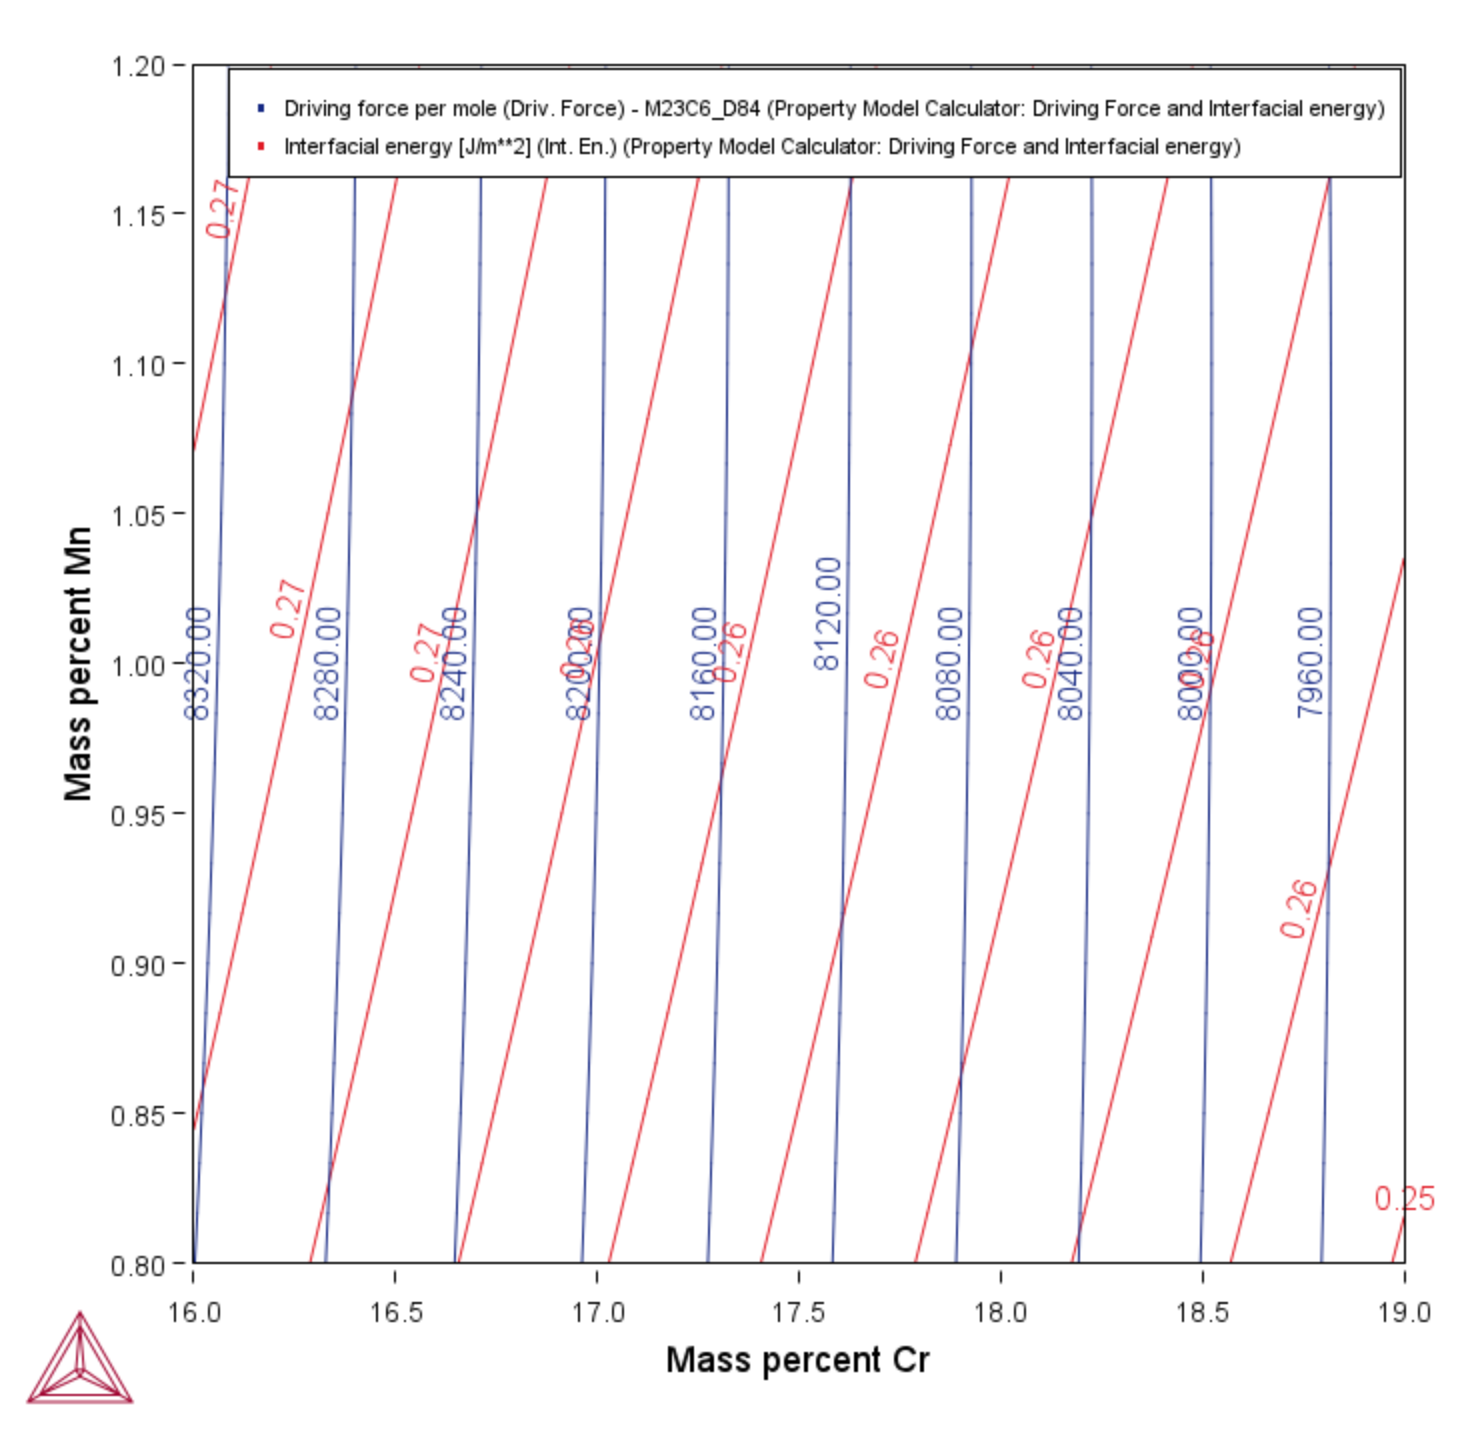
For a Contour plot, Z-axis variable values are traced with curves in the same way that height values are traced with curves on a topographical map. The colors used originate from the different data series.
Thermo-Calc General Property Model example PM_G_03 uses a Property Model Calculator with a Grid Calculation type to compare the driving force and interfacial energy on an overlaid contour plot.
PM_G_03: Driving Force and Interfacial Energy
3D
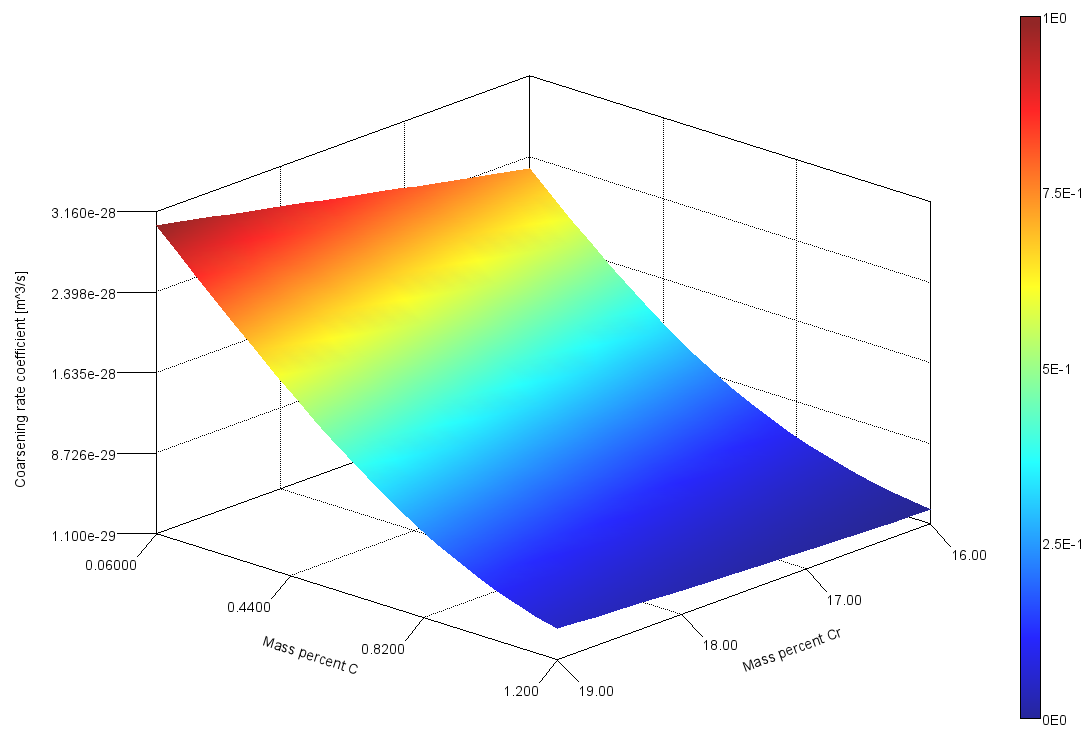
For a 3D plot, the 3D surface is created by Delaunay tesselation of the calculated data. The surface uses a cold to warm color map where red represents the highest Z-axis variable value and blue represents the lowest Z-axis variable value. The color map color legend can be turned on or off with the legend option.
3D Plots with additional functionality are also available with the Add-on Additive Manufacturing (AM) Module. The information is described separately and included with the Module's documentation.
When in the Thermo-Calc help (press F1), go to Rotating 3D Plots to watch a short video showing you how to rotate this plot in the Visualizations window.
Thermo-Calc General Property Model example PM_G_02 uses a Property Model Calculator with a Grid Calculation type to plot the coarsening rate coefficient as a 3D plot.


