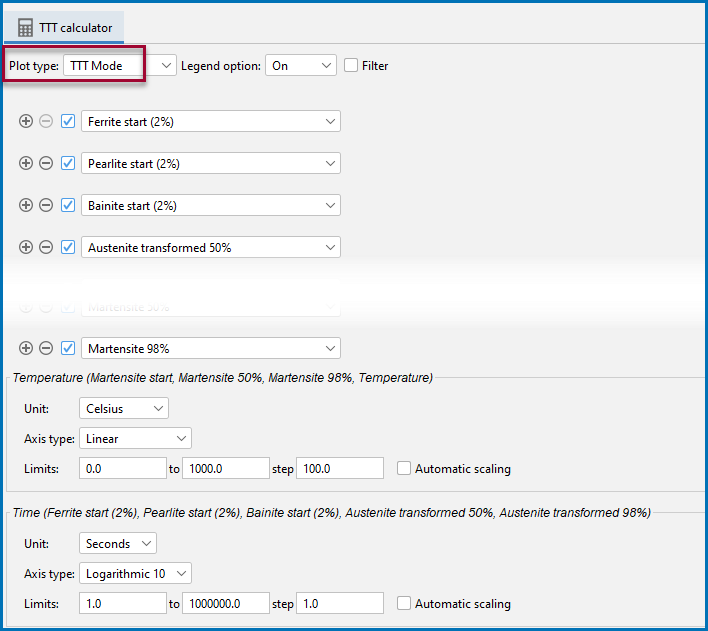
Plot Type: TTT Mode
The Plot Renderer is a dynamic activity node with options such as being able to choose from a variety of Plot types based on the Calculator and Calculation Type selected.
Calculation Types in Graphical Mode
See Plot Types detailing availability By Calculator, By Plot Type, or By Calculation Type.
Use TTT Mode to make a TTT diagram from a One Axis calculation with temperature. The X- and Y-axes are Time and Temperature, respectively. Time quantities (such as Pearlite start, Bainite start) are plotted as functions of temperature. Temperature quantities (such as Martensite start, Martensite 50%) are independent of time and plotted as horizontal lines.
This plot type is available with the Steel Model Library, which requires specific maintenance and database licenses. See About the Steel Model Library Property Models.
In general, this plot type is available from the drop-down list in these situations:
- When you add the Steel - TTT template (on the
 My Projects Configuration window under Property Models), it is the default type on the Plot Renderer (renamed TTT in the template).
 - When you are using at least one of these Steel Property Models—Martensite Temperatures, Pearlite, or Bainite with a One Axis calculation and when both time and temperature quantities are selected on the Plot Renderer—the TTT Mode is available.
- If a user-defined Property Model has both time and temperature quantities defined in a coupled manner, for example if you create your own Property Model with TC-Python. That is, if you select or create any model where the resulting combination of stepping-quantity and result-quantities has both time and temperature definitions.
Property Model Calculator: Configuration Window Settings and Plot Renderer: Configuration Settings
Steel Library TTT Diagram Template
The settings example below uses Property Model example PM_Fe_06: TTT Diagram for Fe-C-Mn-Si-Cr-V.
TTT Mode on a Plot Renderer as a successor to a Property Model Calculator.
