PM_G_10: Freeze-in Thermal Conductivity
The example uses the Property Model Calculator and the Equilibrium with Freeze-in Temperature Property Model to compare the use of the model with thermal conductivity with and without grain boundary (GB) phase scattering being included in the calculation.
The TCS Al-based Alloy Database (TCAL) is used to evaluate a 7075_T6 alloy (Al-1.6Cu-2.5Mg-5.6Zn-0.25Fe-0.15Mn-0.23Cr-0.2Ti-0.2Si) mass%. The "T6" in the alloy name means that the alloy has been artificially peak-aged, i.e. the matrix is almost depleted. The heating is assumed to be at a typical artificial aging temperature of 150 °C. The temperature has then been increased for measuring of the reported values thermal conductivity at 400, 500, and 532 °C.
The thermal conductivity due to grain boundary phase scattering is approximated as a scattering constant times the total volume fraction of the grain boundary phases. The contribution to thermal conductivity is assumed to be related to that to electrical resistivity, following the Wiedemann-Franz law.
The calculation set up assumes that the alloy reaches equilibrium at the peak-age temperature, i.e. that the amounts of phases and their composition freeze-in at 150 °C and that these do not change for the evaluation of thermal conductivity at the temperatures 400, 500, and 532 °C. Calculations are compared between accounting and ignoring contributions from grain boundary (GB) phase scattering.
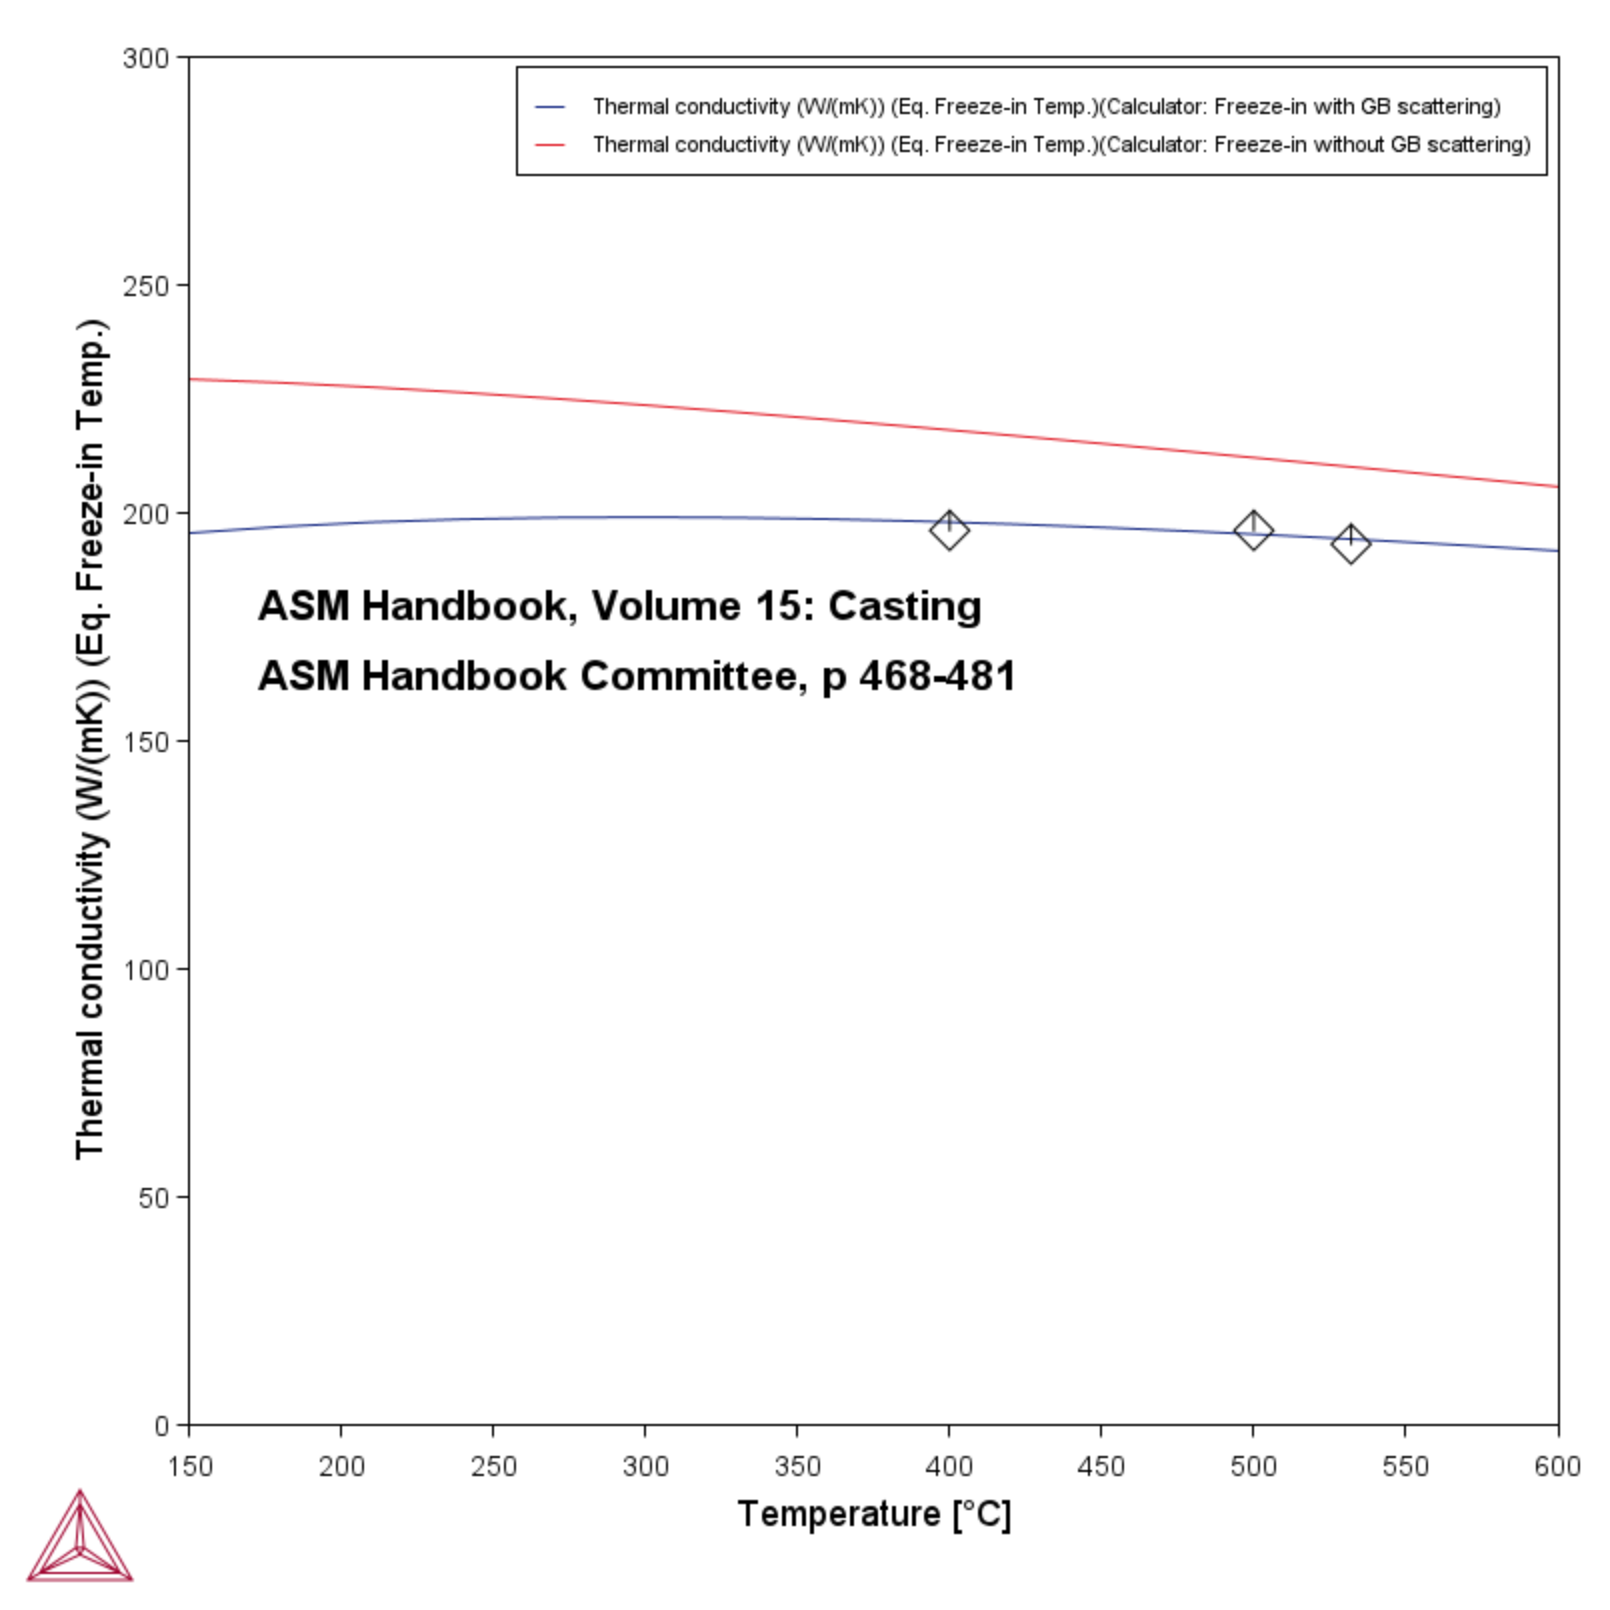
As can be seen in Figure 1, the calculation including the approximate effect of grain boundary phase scattering is close to the experimentally measured values. Excluding the effect of grain boundary phase scattering slightly overestimates the thermal conductivity. Experimental data is from [2008ASM].
About the Equilibrium with Freeze-in Temperature Property Model
- Folder: Property Models → General
- File name: PM_G_10_Freeze_In_Thermal_Conductivity.tcu
The TCS Al-based Alloy Database (TCAL) is used in this example. A valid license for version 7 (TCAL7) or newer is required to run the example.
Visualizations
Many of our Graphical Mode examples have video tutorials, which you can access in a variety of ways. When in Thermo‑Calc, from the menu select Help → Video Tutorials, or from the main My Project window, click Video Tutorials. Alternately, you can go to the website or our YouTube channel.
Open the example project file to review the node setup on the Project window and the associated settings on the Configuration window for each node. For some types of projects, you can also adjust settings on the Plot Renderer Configuration window to preview results before performing the simulation. Click Perform Tree to generate plots and tables to see the results on the Visualizations window.
Figure 1: Comparing the freeze-in temperature for the 7075_T6 alloy with and without grain boundary (GB) scattering included in the calculations.
Reference
[2008ASM] ASM Handbook Committee, ASM Handbook Volume 15: Casting. ASM International, p. 468-481, 2008, ISBN 978-0-87170-711-6.
