PM_G_15: Columnar to Equiaxed Transition (CET) of a NiAlCr Alloy
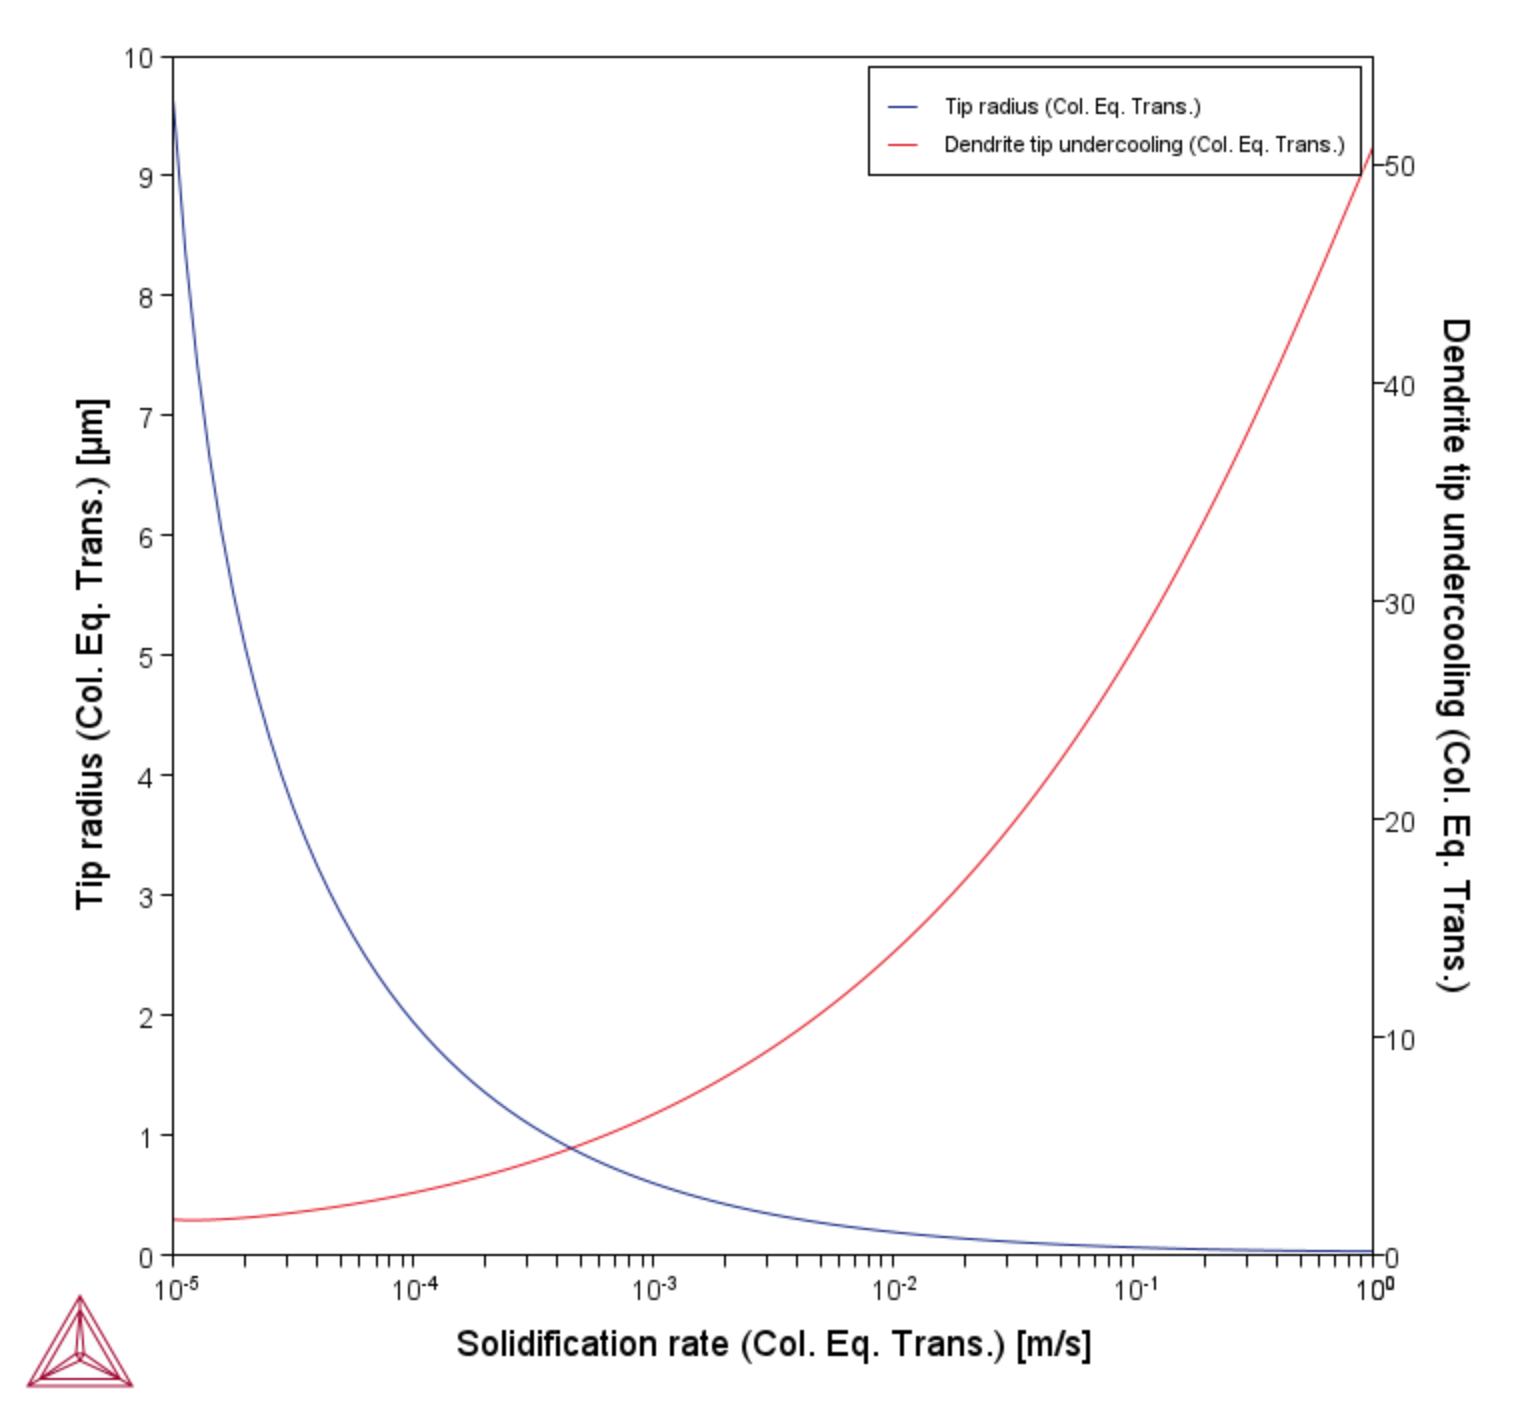
This example uses the Property Model Calculator and the Columnar to Equiaxed Transition Property Model with nickel demo databases to mimic the result of CMSX-4 alloy, which compares the tip radius and undercooling with growth velocity.
A Ni-26Al-9Cr (at.%) alloy is used so that its calculated undercooling is close to that of a 10-component CMSX-4 alloy. A One Axis calculation for the FCC_L12 primary phase is done using the CET parameters entered on the Property Model Calculator Configuration window.
The settings used are the same as those from the literature [2001Gäu], i.e.:
- Number of nucleation sites:
2.0E15/m3 - Equiaxed exponent:
3.4 - Nucleation undercooling:
2.5K - Solve for: Thermal gradient
- Equiaxed fractions:
0.0066 0.1
About the Columnar to Equiaxed Transition (CET) Property Model
- Folder: Property Models → General
- File name: PM_G_15_Ni-Al-Cr_Columnar_Equiaxed_Transition.tcu
The NIDEMO and MNIDEMO databases are used in this example and it is available to all users.
Also see these examples that use the same Property Model. However, these examples require licenses as they use the TCS Ni-based Superalloys Database (TCNI) and TCS Ni-alloys Mobility Database (MOBNI): PM_G_16: Columnar to Equiaxed Transition of a CMSX-4 Alloy and PM_G_17: Columnar to Equiaxed Transition of an IN718 Alloy.
Visualizations
Many of our Graphical Mode examples have video tutorials, which you can access in a variety of ways. When in Thermo‑Calc, from the menu select Help → Video Tutorials, or from the main My Project window, click Video Tutorials. Alternately, you can go to the website or our YouTube channel.
Open the example project file to review the node setup on the Project window and the associated settings on the Configuration window for each node. For some types of projects, you can also adjust settings on the Plot Renderer Configuration window to preview results before performing the simulation. Click Perform Tree to generate plots and tables to see the results on the Visualizations window.
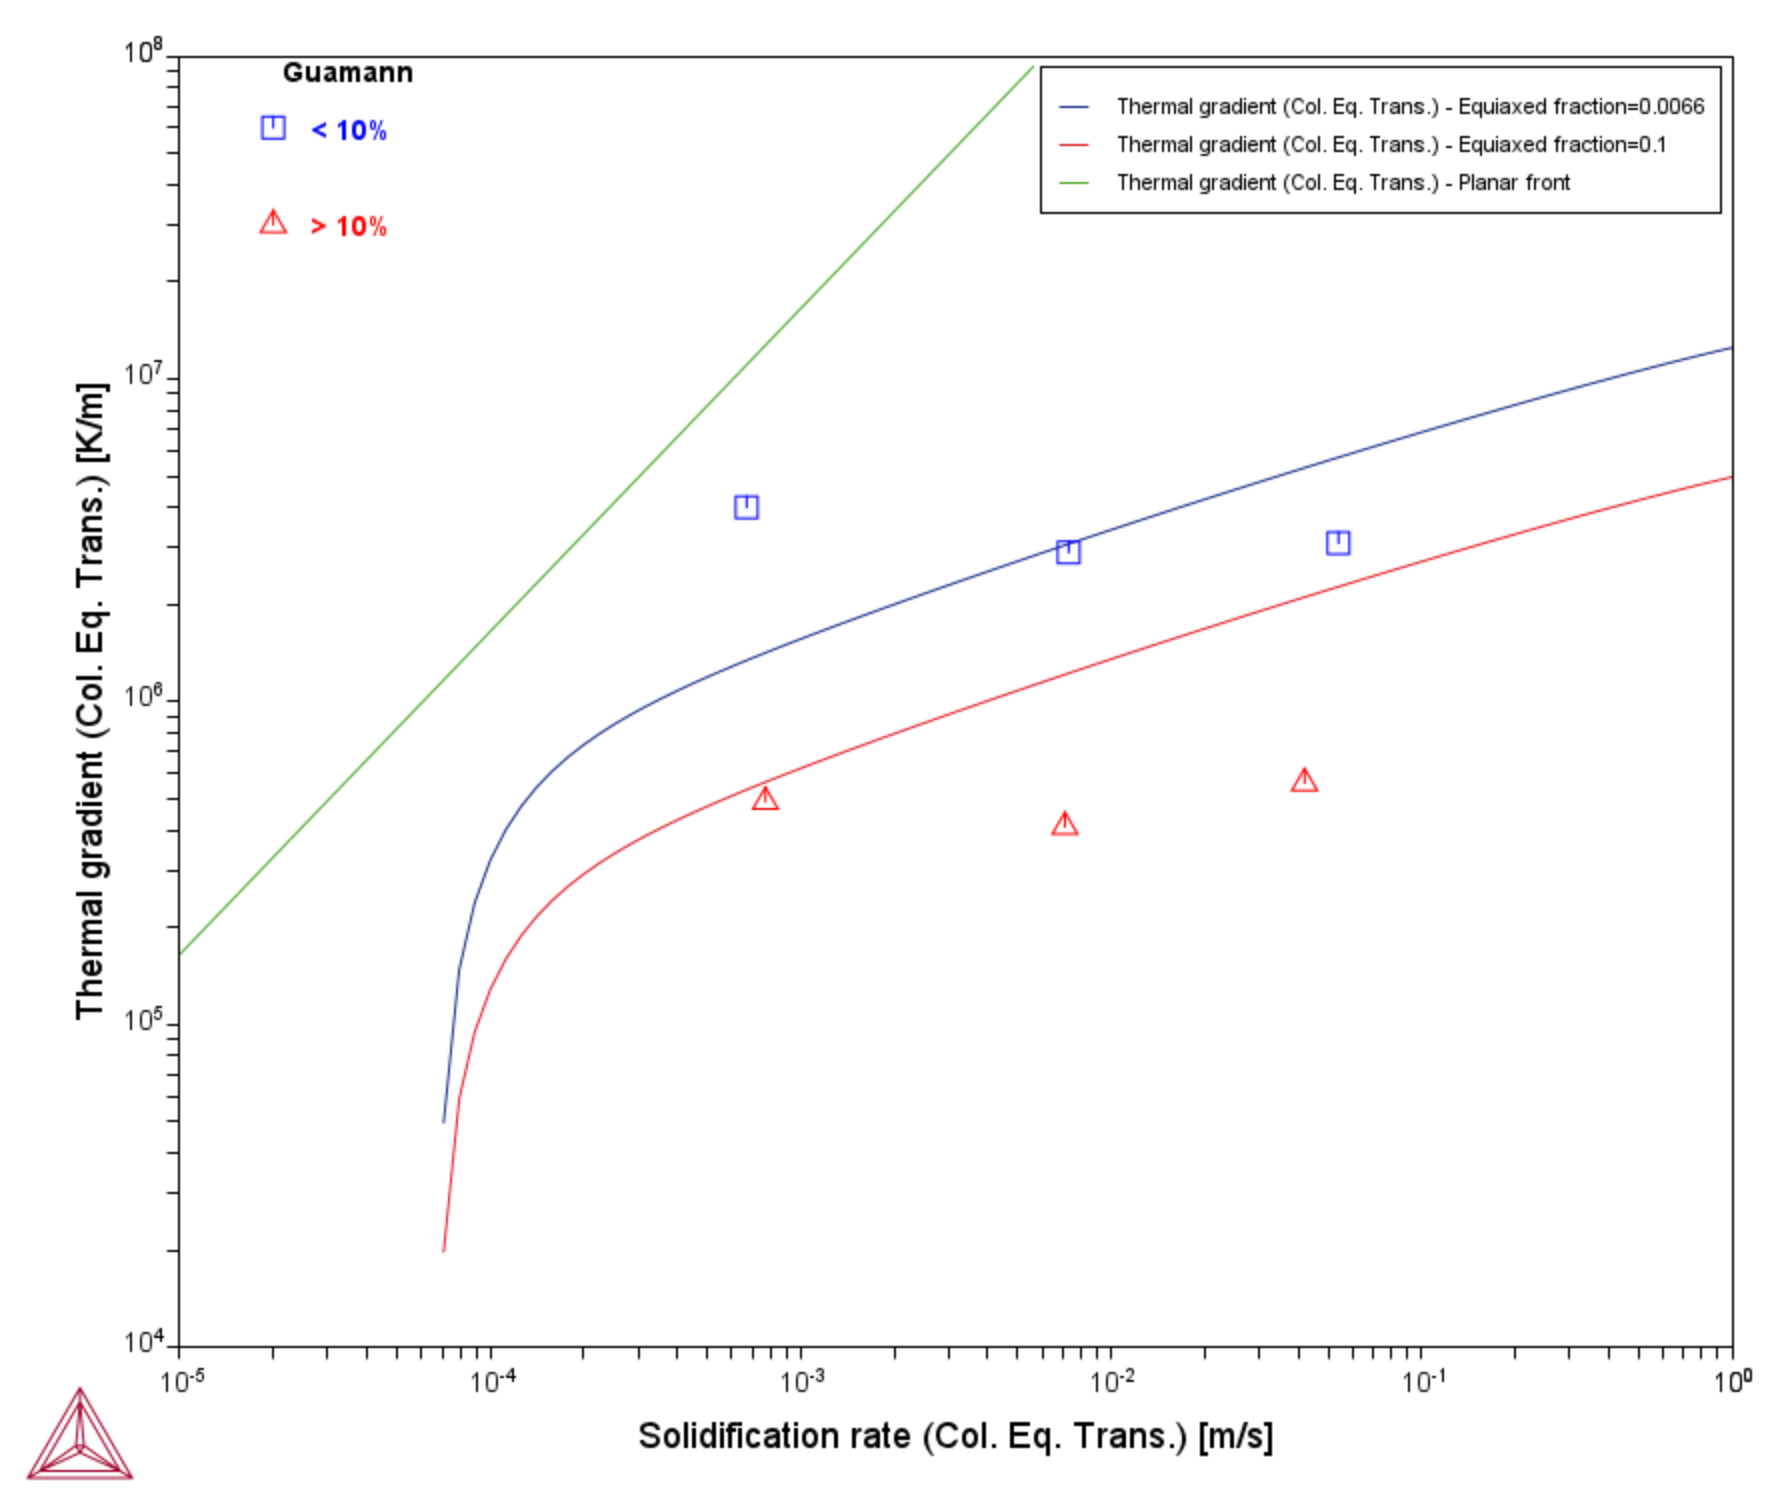
Figure 2: CET curves for a Ni-26Al-9Cr alloy using experimental data from [2001Gäu]. Also see PM_G_16 to compare the results to the CMSX-4 alloy results.
Reference
[2001Gäu] M. Gäumann, C. Bezençon, P. Canalis, W. Kurz, Single-crystal laser deposition of superalloys: processing–microstructure maps. Acta Mater. 49, 1051–1062 (2001).

