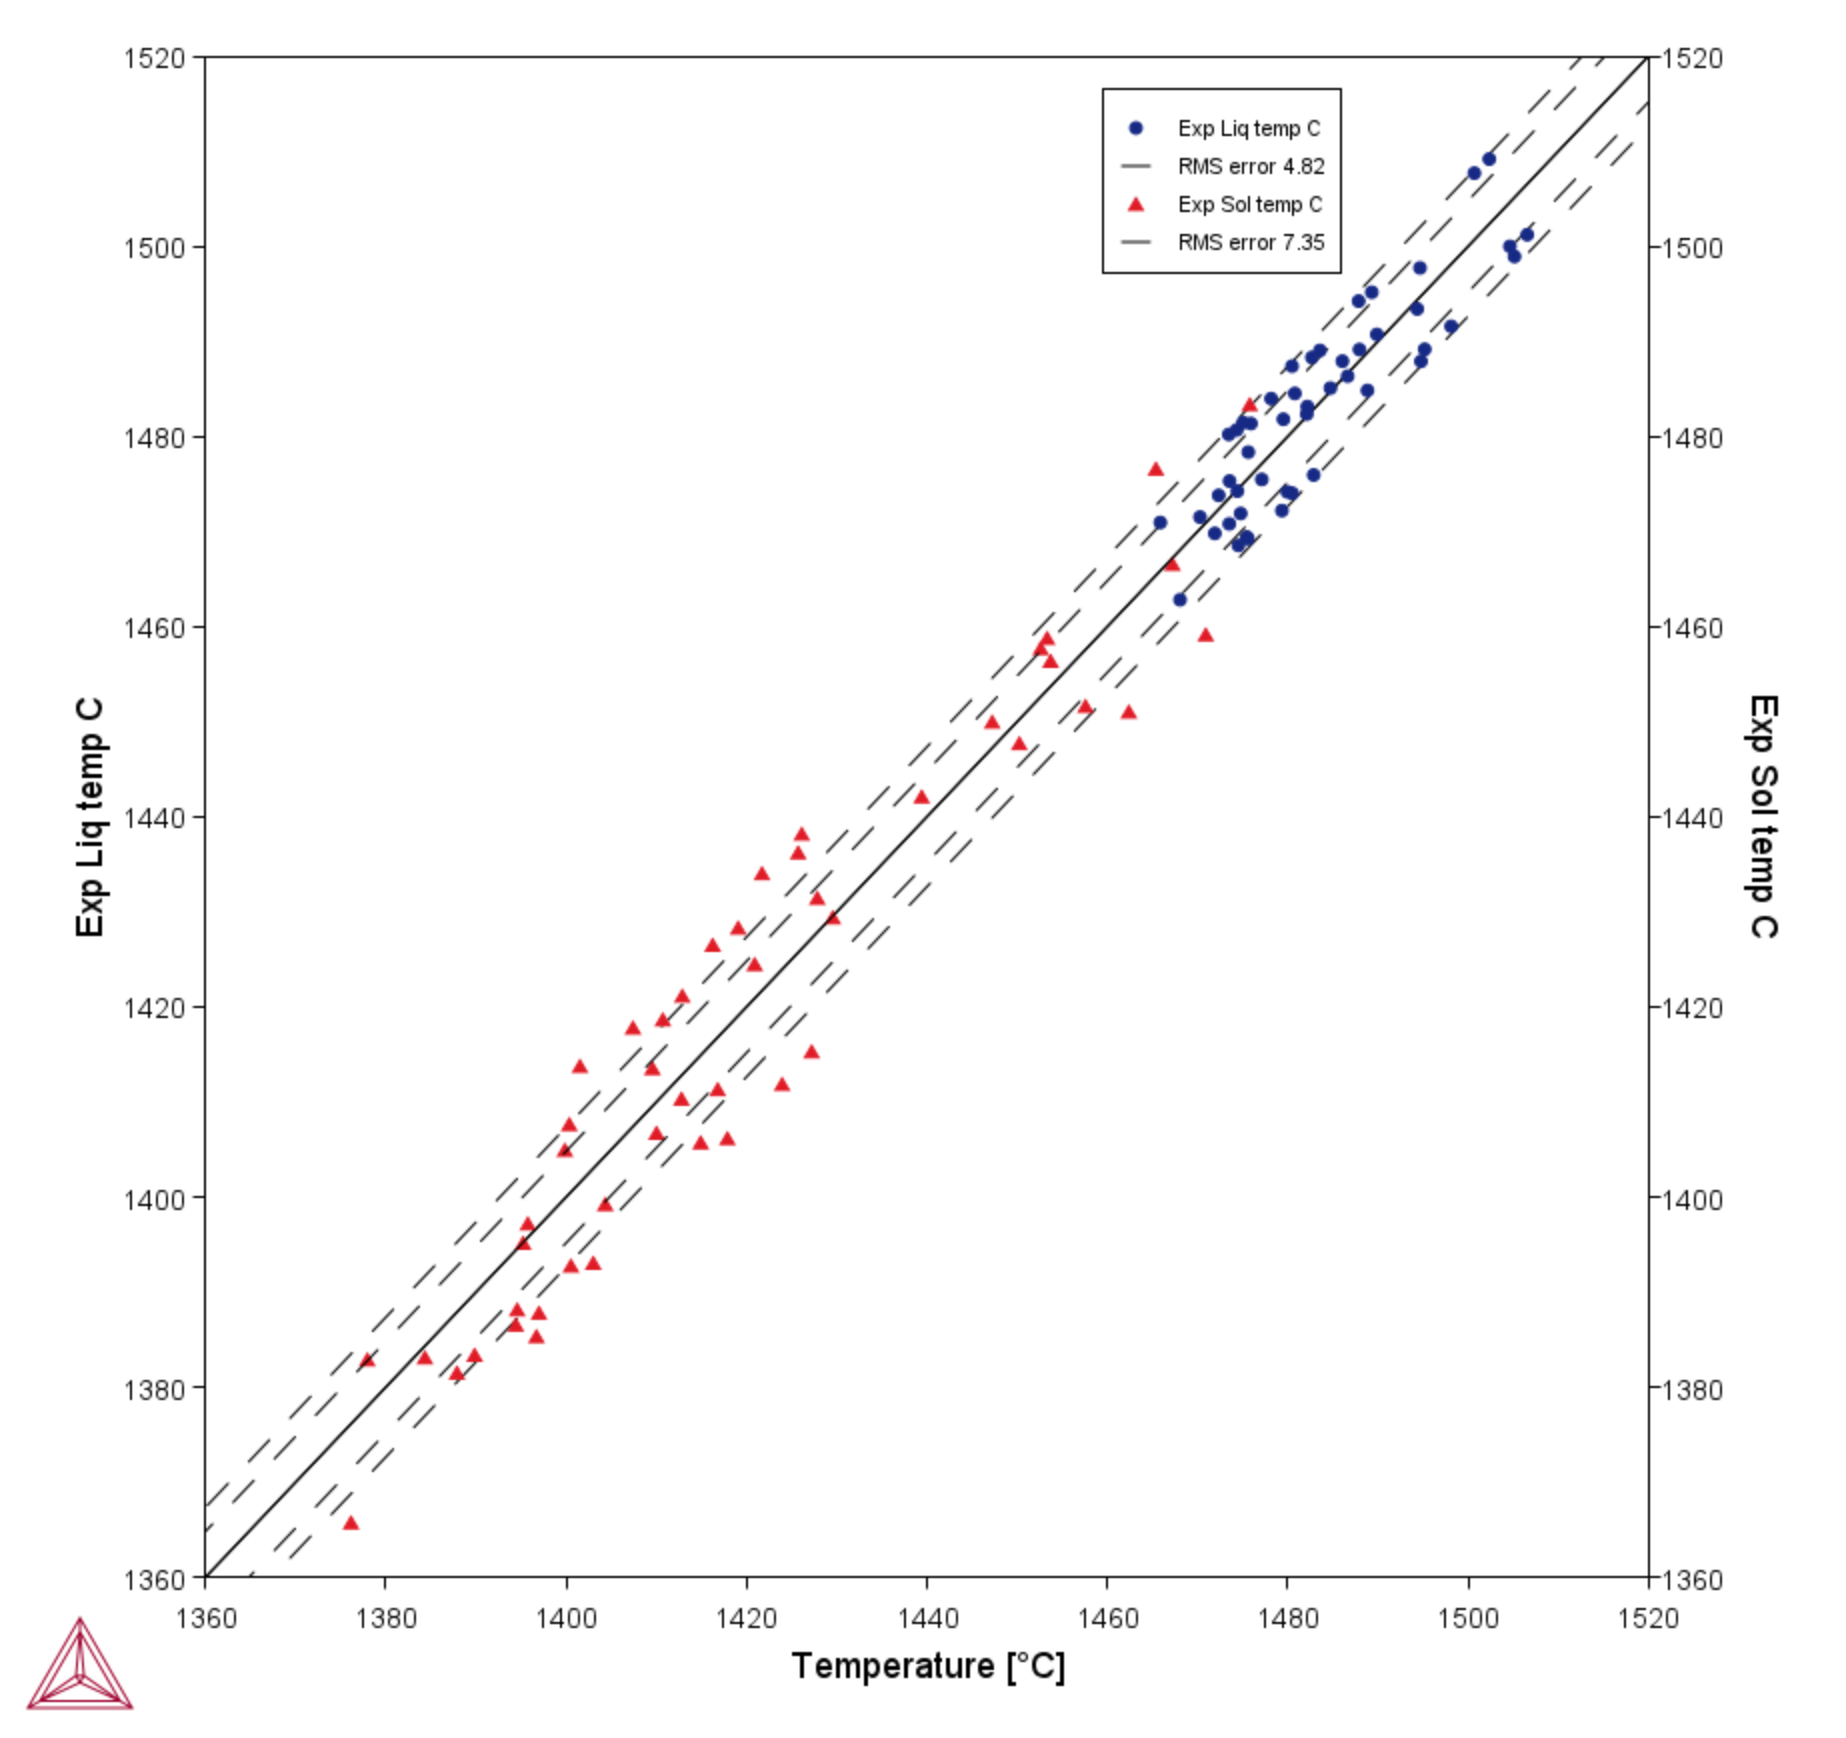
PM_G_12: Solidus and Liquidus Batch Calculation
The example uses the Property Model Calculator and the Liquidus and Solidus Temperature Property Model to demonstrate the use of the Batch Calculation Type.
The thermodynamic demonstration steel database (FEDEMO) is used along with a randomized set of experimental data points that are shown on the Configuration window in a table. The data showing in this example is imported from a data file prepared with specific data entry requirements.
A variety of compositions for an Fe-Cr-Mn-Ni-C alloy is used for the calculations; these compositions are also taken from the same data file. When the heading includes Exp, then these columns are considered experimental data by Thermo-Calc, where in this example it is the columns titled Exp Liq temp C and Exp Sol temp C. This experimental data can then be plotted as a function of the calculated solidus/liquidus temperature and compared on the plot using a Cross plot, which is selected on the Plot Renderer. The limits are shown using the setting RMS (root mean square).
The experimental data entered into the batch data file is unitless even though the actual experimental data unit is Celsius (as written in the header text). In order for the plot and calculations to match, Celsius is chosen as the temperature unit when defining the Solidus/Liquidus Property Model and all the axes manually scaled to the same limits (1360 → 1520).
Working with Batch Calculations
- Folder: Property Models → General
- File name: PM_G_12_Solidus_and_Liquidus_Batch_Calculation.tcu
Visualizations
This example is included as a Property Model tutorial on our website and as part of the Property Model Calculator playlist on our YouTube channel.
Open the example project file to review the node setup on the Project window and the associated settings on the Configuration window for each node. For some types of projects, you can also adjust settings on the Plot Renderer Configuration window to preview results before performing the simulation. Click Perform Tree to generate plots and tables to see the results on the Visualizations window.
