PM_G_06: Yield Strength HEA
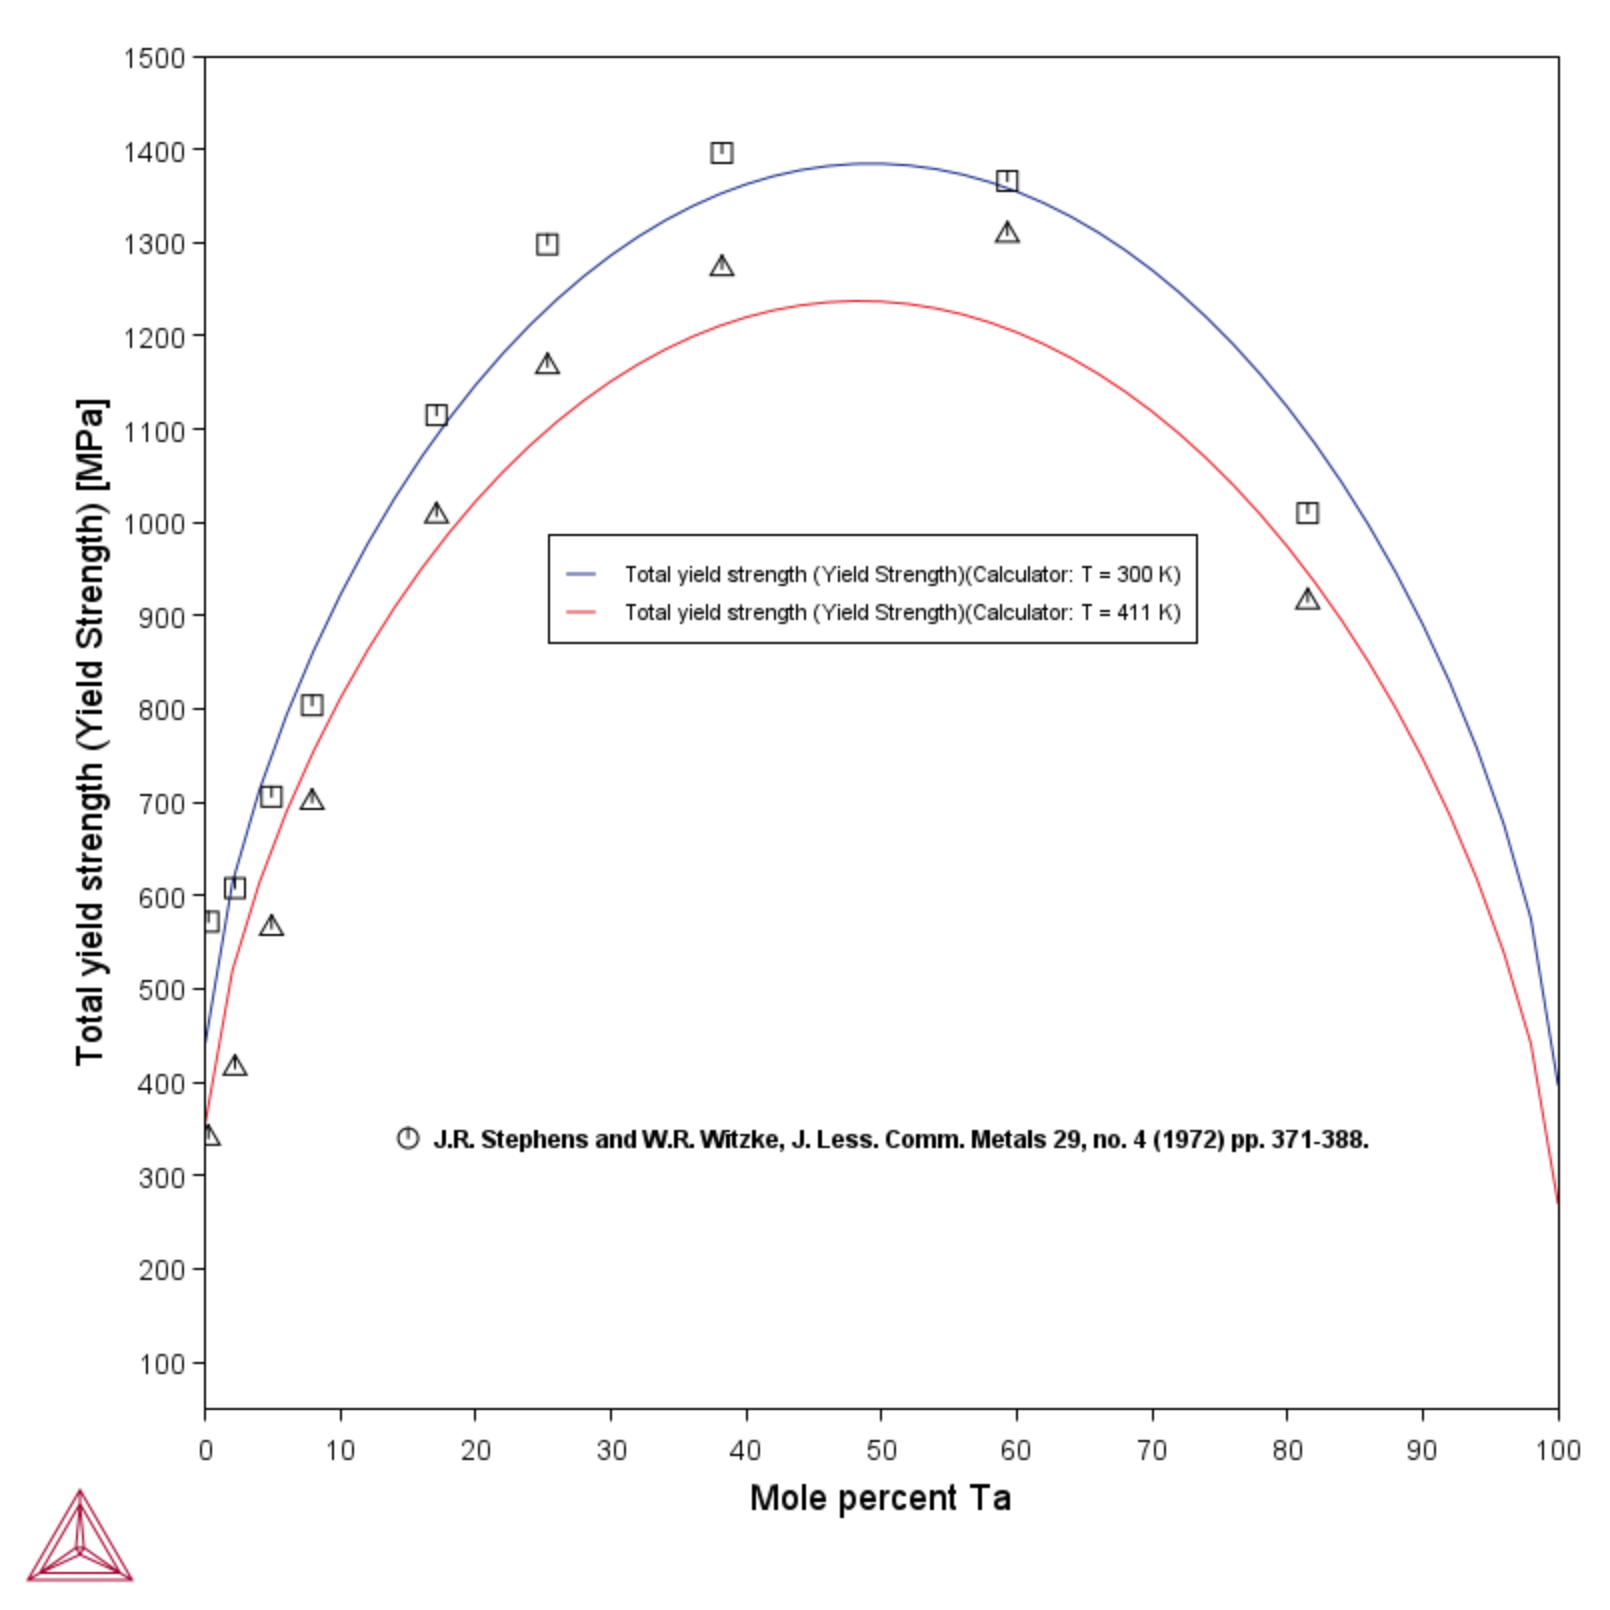
The example uses the Property Model Calculator and the Yield strength Property Model with the thermodynamic TCS High Entropy Alloys Database (TCHEA). It is an example of solid solution strengthening, which is the contribution to total strength due to the elastic strains in the crystal lattice caused by alloying elements of a lattice parameter differing from the main constituent. The example shows the solid solution strengthening at 300 K and 411 K over the full solubility range for the Mo-Ta system as compared to experimental data [1972Ste].
For more settings information, see Yield Strength Property Model: Simplified Mode Settings and for additional theoretical information about the models, see About the Yield Strength Property Model.
- Folder: Property Models → General
- File name: PM_G_06_Yield_Strength_HEA.tcu
This example requires the use of the TCS High Entropy Alloys Database (TCHEA). A license is required to run the example.
This example is configured to run with BCC_A2 selected and BCC_B2/BCC_B2#2 deselected in the System Definer → Phases and Phase Constitution tab, when using version 8 (TCHEA8) or higher. If the database is changed to an earlier version, this selection is reset by the software and you need to either manually re-apply these settings on the System Definer or reopen the example.
Visualizations
Many of our Graphical Mode examples have video tutorials, which you can access in a variety of ways. When in Thermo‑Calc, from the menu select Help → Video Tutorials, or from the main My Project window, click Video Tutorials. Alternately, you can go to the website or our YouTube channel.
Open the example project file to review the node setup on the Project window and the associated settings on the Configuration window for each node. For some types of projects, you can also adjust settings on the Plot Renderer Configuration window to preview results before performing the simulation. Click Perform Tree to generate plots and tables to see the results on the Visualizations window.
Figure 1: The solid solution strengthening over the full solubility range for the Mo-Ta system as compared to experimental data [1972Ste].
Reference
[1972Ste] J. R. Stephens, W. R. Witzke, Alloy hardening and softening in binary molybdenum alloys as related to electron concentration. J. Less Common Met. 29, 371–388 (1972).
