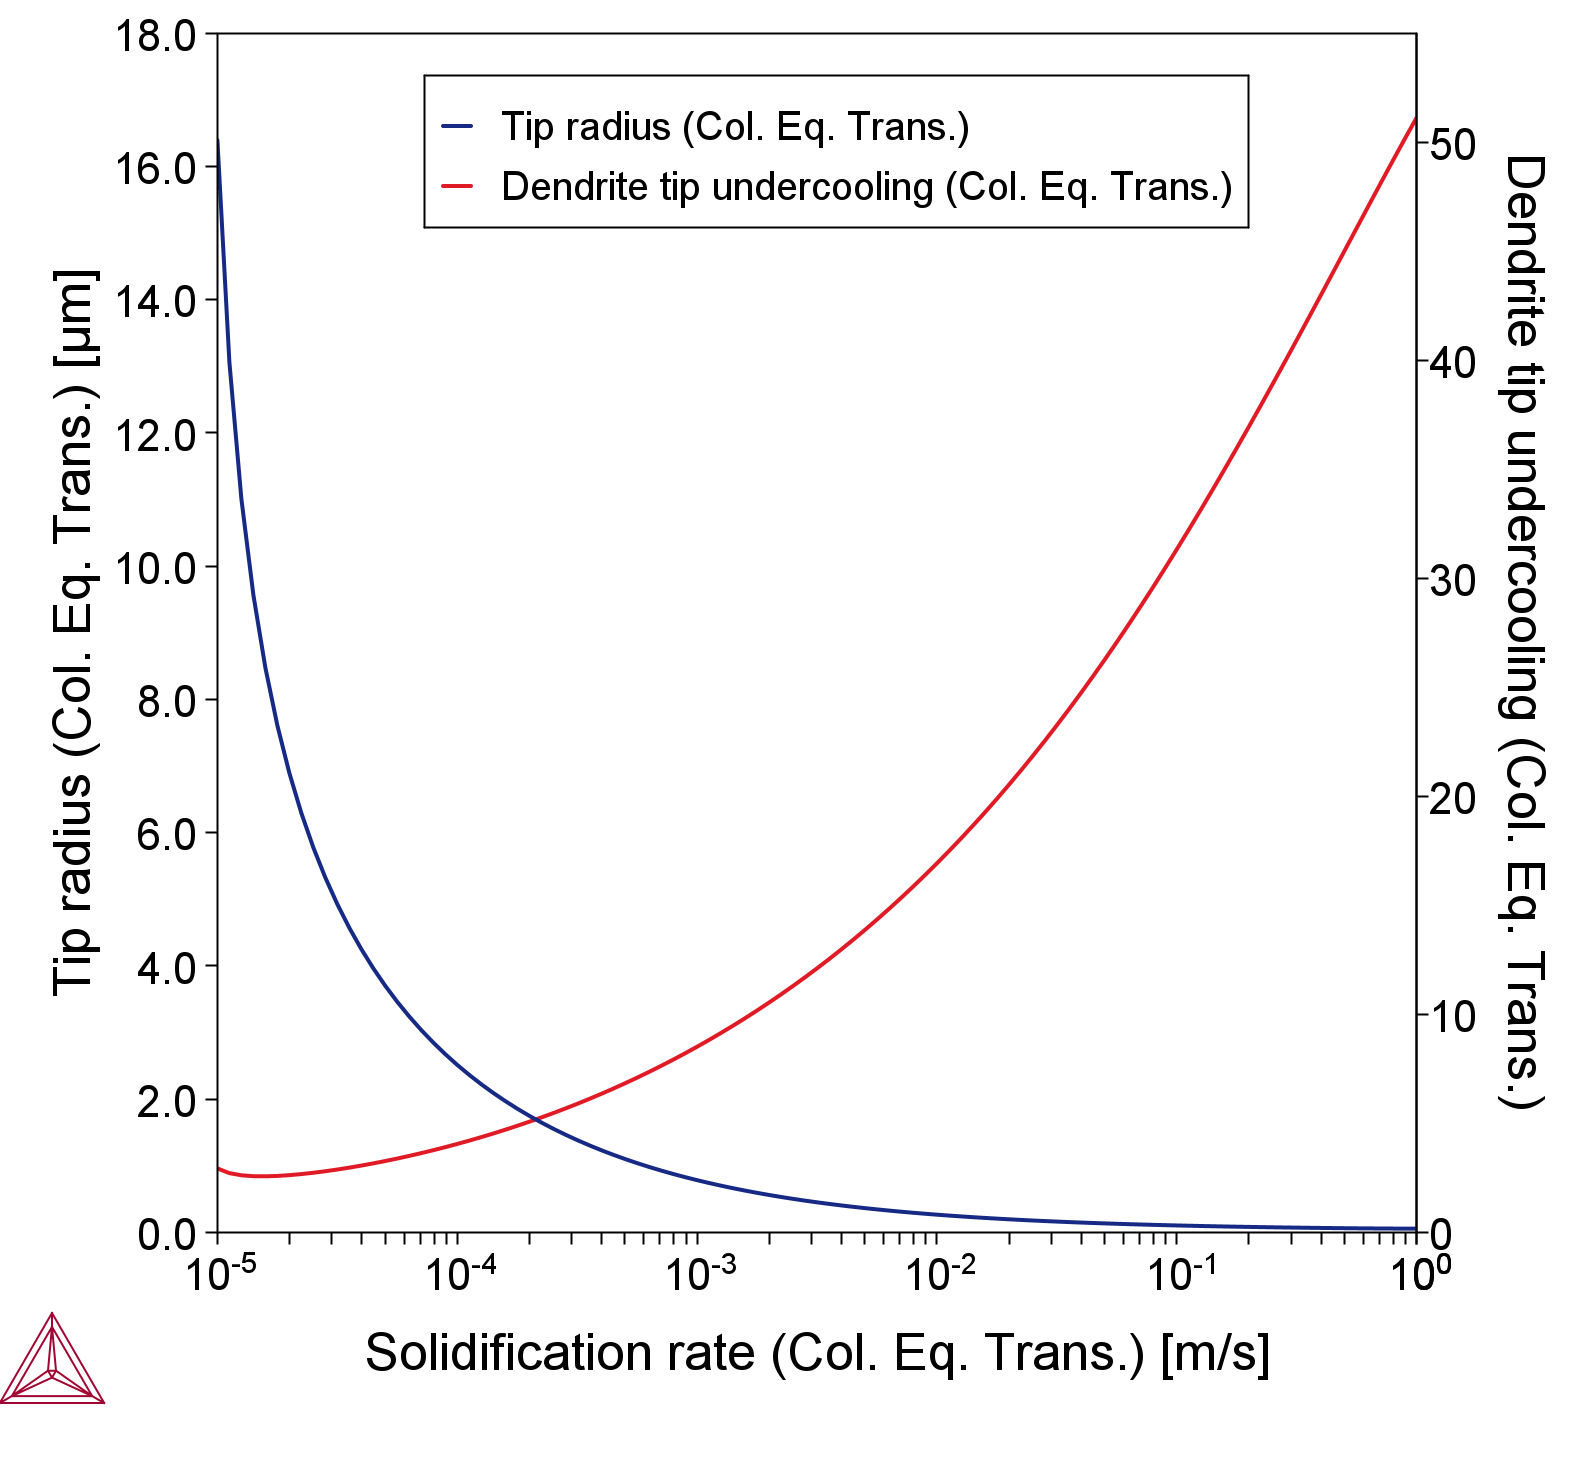
PM_G_16: Columnar to Equiaxed Transition of a CMSX-4 Alloy
This example uses the Property Model Calculator and the Columnar to Equiaxed Transition Property Model with a CMSX-4 alloy to compare calculated CET curves to experimental data.
About the Columnar to Equiaxed Transition (CET) Property Model
A 10-component system, with a composition from Gäumann et al. [2001Gäu], is used for this simulation of a CMSX-4 alloy.
| Co | Cr | Al | Ti | W | Ta | Re | Hf | Mo | Ni | |
|---|---|---|---|---|---|---|---|---|---|---|
| wt.% | 9.0 | 6.5 | 5.6 | 1.0 | 6.0 | 6.5 | 3.0 | 0.1 | 0.6 | Bal |
| at.% | 9.262 | 7.581 | 12.587 | 1.267 | 1.979 | 2.178 | 0.977 | 0.034 | 0.379 | Bal |
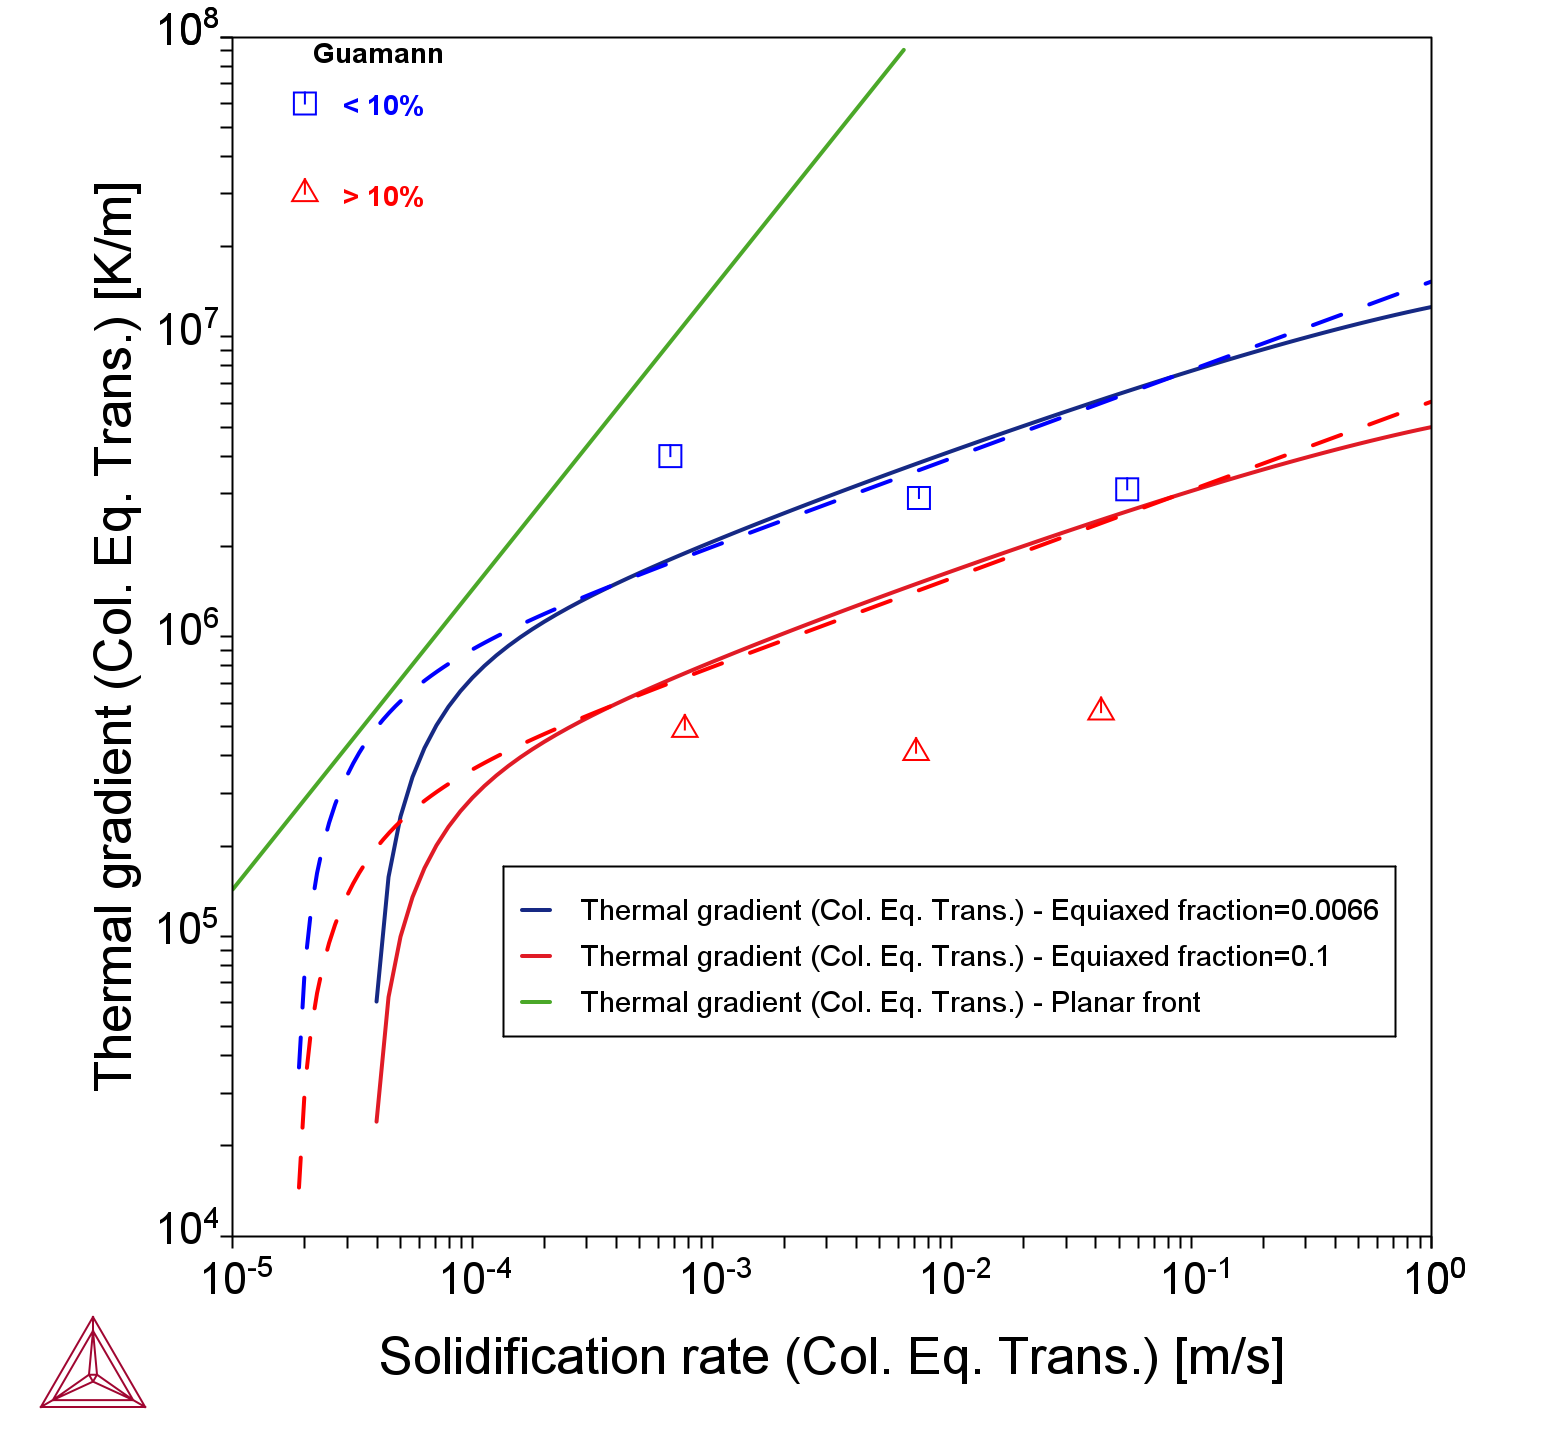
The results are compared with literature data (epitaxial laser metal forming) and the original model [1999Gäu; 2001Gäu].
A One Axis calculation for the FCC_L12 primary phase is done using the CET parameters entered on the Property Model Calculator Configuration window.
The settings entered include:
- Interfacial energy:
0.25J/m2, which gives a Gibbs-Thomson coefficient of 1.87 x 10⁻⁷ mK, in agreement with the literature [2001Gäu]. - Number of nucleation sites:
2.0E15/m3 - Nucleation undercooling :
3.0K - Equiaxed exponent:
3.4 - Solve for: Thermal gradient
- Equiaxed fractions:
0.0066 0.1
In the calculation, the nucleation undercooling is slightly larger than originally used (2.5 K) [2001Gäu], since it has been found that at a low speed limit, the Property Model gives an undercooling close to 3 K.
The original value is arbitrary and does not affect the results at a high speed range.
- Folder: Property Models → General
- File name: PM_G_16_CMSX-4_Columnar_Equiaxed_Transition.tcu
To run this example requires a license for the TCS Ni-based Superalloys Database (TCNI) version 12 (TCNI12) or newer and the TCS Ni-alloys Mobility Database (MOBNI) version 6 (MOBNI6) or newer.
Example PM_G_15: Columnar to Equiaxed Transition (CET) of a NiAlCr Alloy uses demo databases available to everyone and mimics this alloy in its results.
Visualizations
Many of our Graphical Mode examples have video tutorials, which you can access in a variety of ways. When in Thermo‑Calc, from the menu select Help → Video Tutorials, or from the main My Project window, click Video Tutorials. Alternately, you can go to the website or our YouTube channel.
Open the example project file to review the node setup on the Project window and the associated settings on the Configuration window for each node. For some types of projects, you can also adjust settings on the Plot Renderer Configuration window to preview results before performing the simulation. Click Perform Tree to generate plots and tables to see the results on the Visualizations window.
Figure 2: Calculated CET curves (solid lines) in comparison to experimental data (data points) and calculations (dashed lines) from the literature [2001Gäu].
References
[1999Gäu] M. Gäumann, PhD thesis, Epitaxial laser metal forming of a single crystal superalloy, École polytechnique fédérale de Lausanne (EPFL) (1999).
[2001Gäu] M. Gäumann, C. Bezençon, P. Canalis, W. Kurz, Single-crystal laser deposition of superalloys: processing–microstructure maps. Acta Mater. 49, 1051–1062 (2001).
More Information
Also see these examples that use the same Property Model: PM_G_15: Columnar to Equiaxed Transition (CET) of a NiAlCr Alloy and PM_G_17: Columnar to Equiaxed Transition of an IN718 Alloy.

