P_03: Stable and Metastable Carbides - TTT Diagram
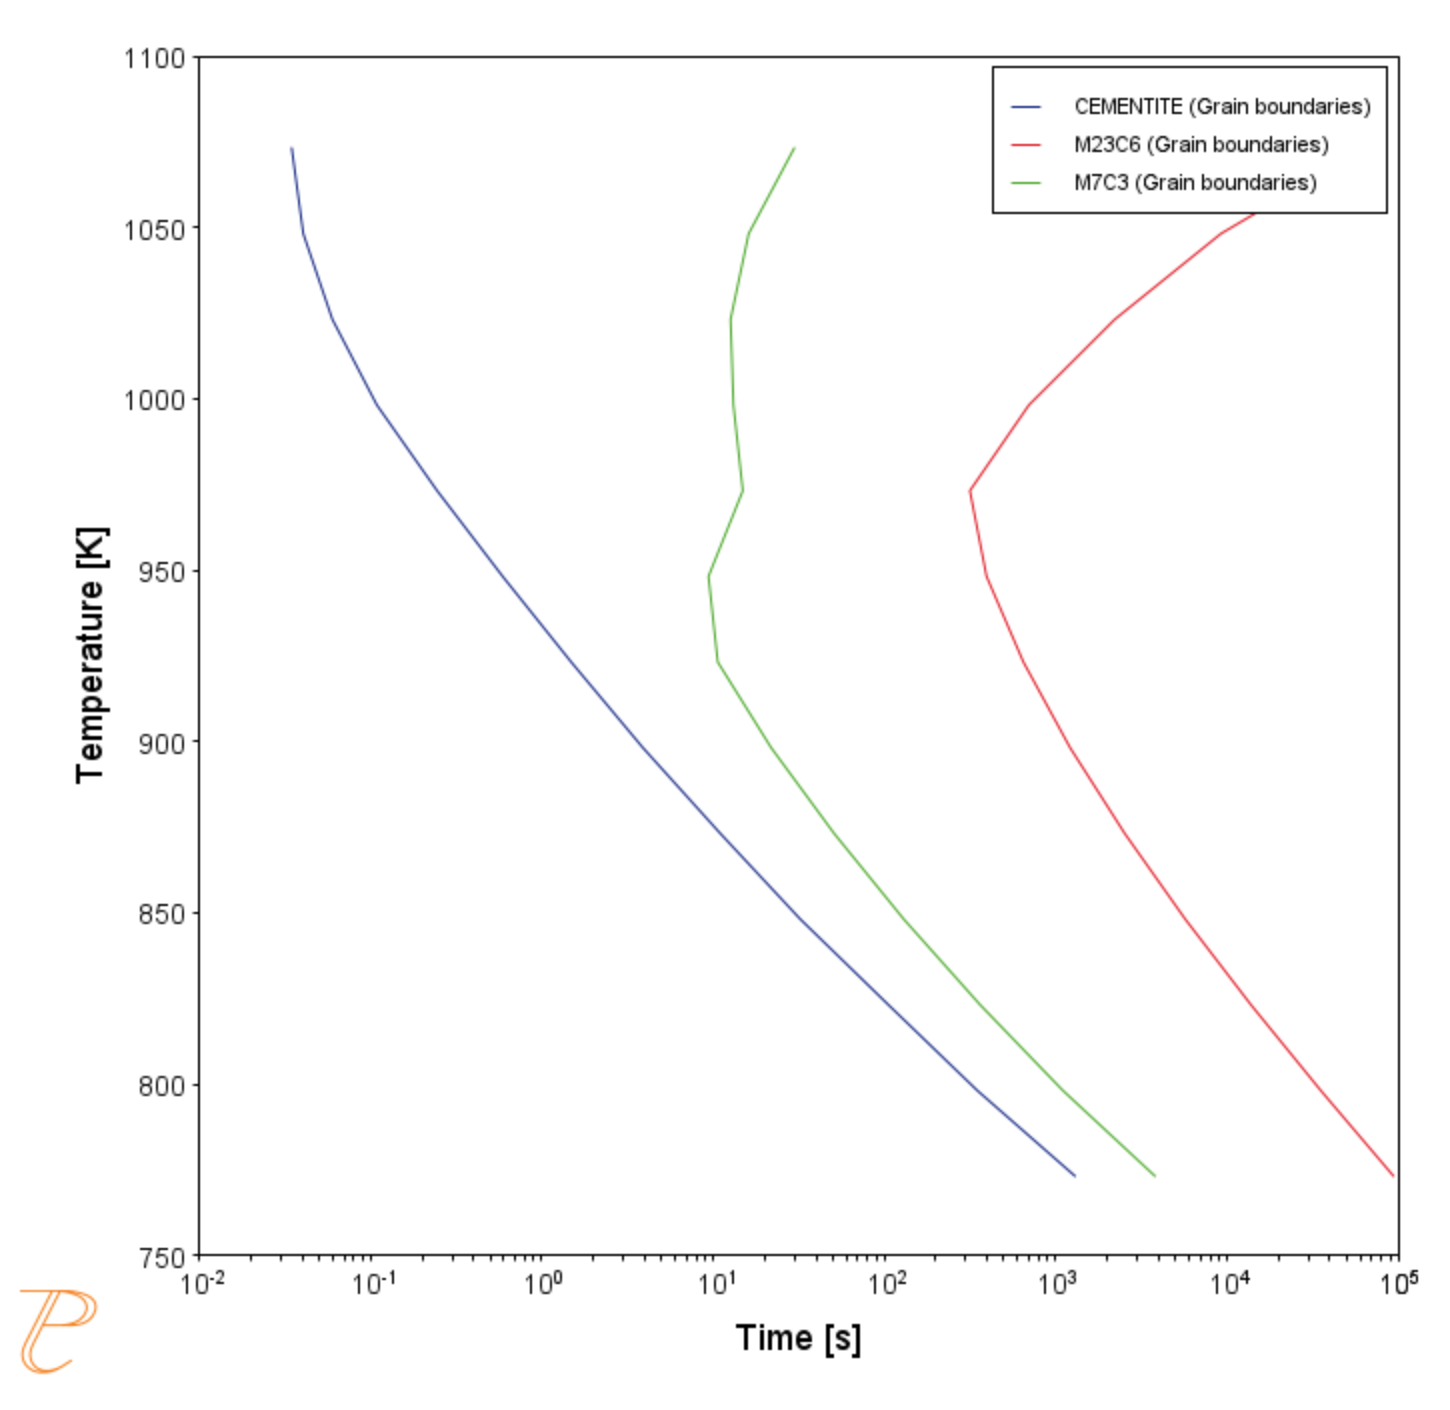
In this example, the kinetics of precipitation of both stable and metastable carbides is calculated from the ferrite phase. It demonstrates that metastable carbides may first emerge and then disappear and the stable phase prevails.
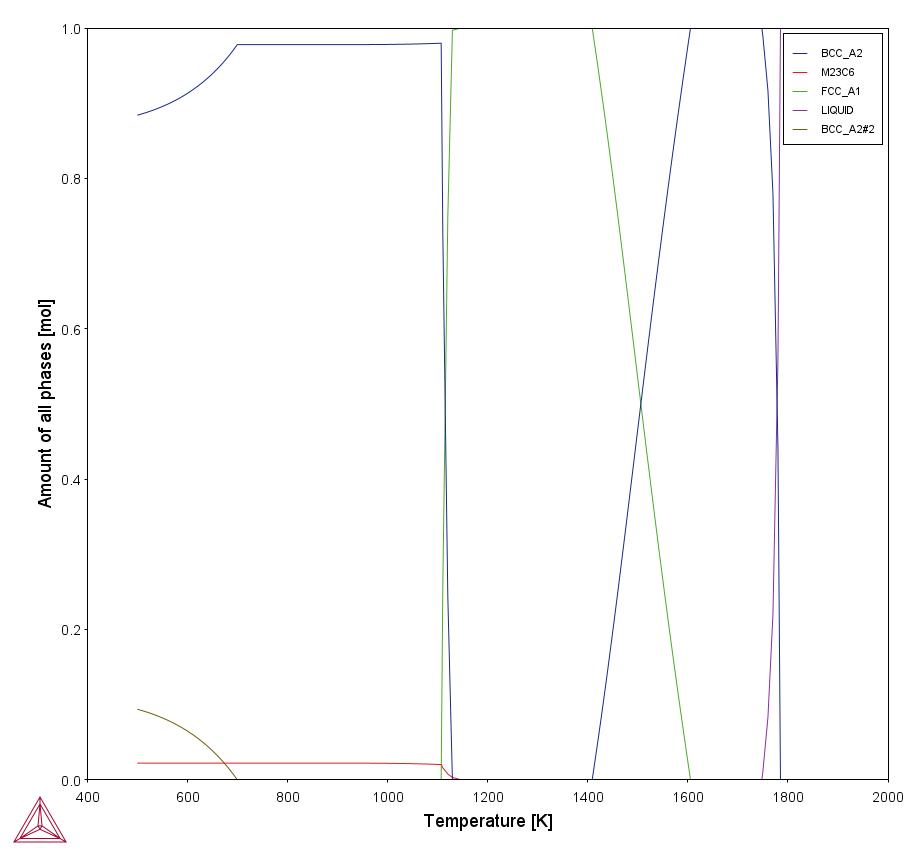
This example uses the Equilibrium Calculator and a one axis calculation type to determine how the phases change with temperature. Using this result, the Precipitation Calculator is used to do a TTT (Time-Temperature-Transformation) diagram calculation of the three phases (cementite, M23C6 and M7C3) at the grain boundaries.
For a TTT diagram calculation, select TTT diagram in Calculation Type, then enter Min, Max, and Step of Temperature, as well as Max annealing time. In Stop criterion, choose Volume fraction of phase and enter the value.
- Folder: Precipitation Module - TC-PRISMA
- File name:
P_03_Precipitation_Fe-C-Cr_TTT_Cementite-M7C3-M23C6.tcu
Example Settings
| System (System Definer) | |
| Database package | Demo: Steels and Fe-alloys (FEDEMO and MFEDEMO) |
| Elements | Fe, C, Cr |
| Conditions (Precipitation Calculator) | |
| Composition | Fe-0.1C-12Cr Mass percent |
| Matrix phase |
BCC_A2 |
| Precipitate phases | Cementite, M23C6 and M7C3 |
| Matrix Phase Data Parameters (Precipitation Calculator) | |
| Grain size (click Show Details to display this setting) | 1.0E-4 m |
| Precipitate Phase Data Parameters | |
| Nucleation sites | Grain boundaries |
| Interfacial energy | Cementite 0.167 J/m2, M23C6 0.252 J/m2, M7C3 0.282 J/m2 |
| Calculation Type (Precipitation Calculator) | |
| Calculation type | TTT diagram |
| Temperature | 500° to 800° C with 25° C steps |
| Max. annealing time | 1.0E8 seconds |
| Stop criteria | Volume fraction of phase is set to 0.0001 |
| Options > Numerical Parameters | |
| No. of grid points over one order of magnitude in radius | 150 |
| Max no. of grid points over one order of magnitude in radius | 200 |
| Min no. of grid points over one order of magnitude in radius | 100 |
Visualizations
Many of our Graphical Mode examples have video tutorials, which you can access in a variety of ways. When in Thermo‑Calc, from the menu select Help → Video Tutorials, or from the main My Project window, click Video Tutorials. Alternately, you can go to the website or our YouTube channel.
Open the example project file to review the node setup on the Project window and the associated settings on the Configuration window for each node. For some types of projects, you can also adjust settings on the Plot Renderer Configuration window to preview results before performing the simulation. Click Perform Tree to generate plots and tables to see the results on the Visualizations window.
There is a variety of information shown in the Visualizations window that can be viewed during configuration and after performing the calculation.
- Thermal Profile: When setting up a calculator on a Configuration window for Isothermal or Non-isothermal Calculation Types, you can preview the profile and adjust settings as needed. When you click a calculator node in the Project window, the matching name of the node is on the tab(s) displayed in the Visualizations window.
For TTT Diagram and CCT Diagram calculations there is nothing shown for the Precipitation Calculator tab in the Visualizations window as there is no Thermal Profile to be defined.
- Plot or Table results: After completing the set up and performing the calculation, to view the matching name of the node on tab(s) in the Visualizations window, either click a Plot Renderer or Table Renderer node in the Project window or click the tabs individually in the Visualizations window.
Figure 1: After performing the calculation, you can view the result on the applicable tab. Here the results from the equilibrium calculator are shown, which assesses the stability of phases across the temperature range of interest.
Figure 2: After performing the calculation, you can view the result on the applicable tab.This shows results from a TTT (Temperature-Transformation) simulation using the Precipitation Calculator to examine the sequence of phase transitions considering the formation of cementite, M7C3, and M23C6 carbide phases. The previous Equilibrium Calculator reveals the temperatures where the cementite and M7C3 are metastable.

