P_10: Initial Particle Size Distribution of Fe-Cr-C
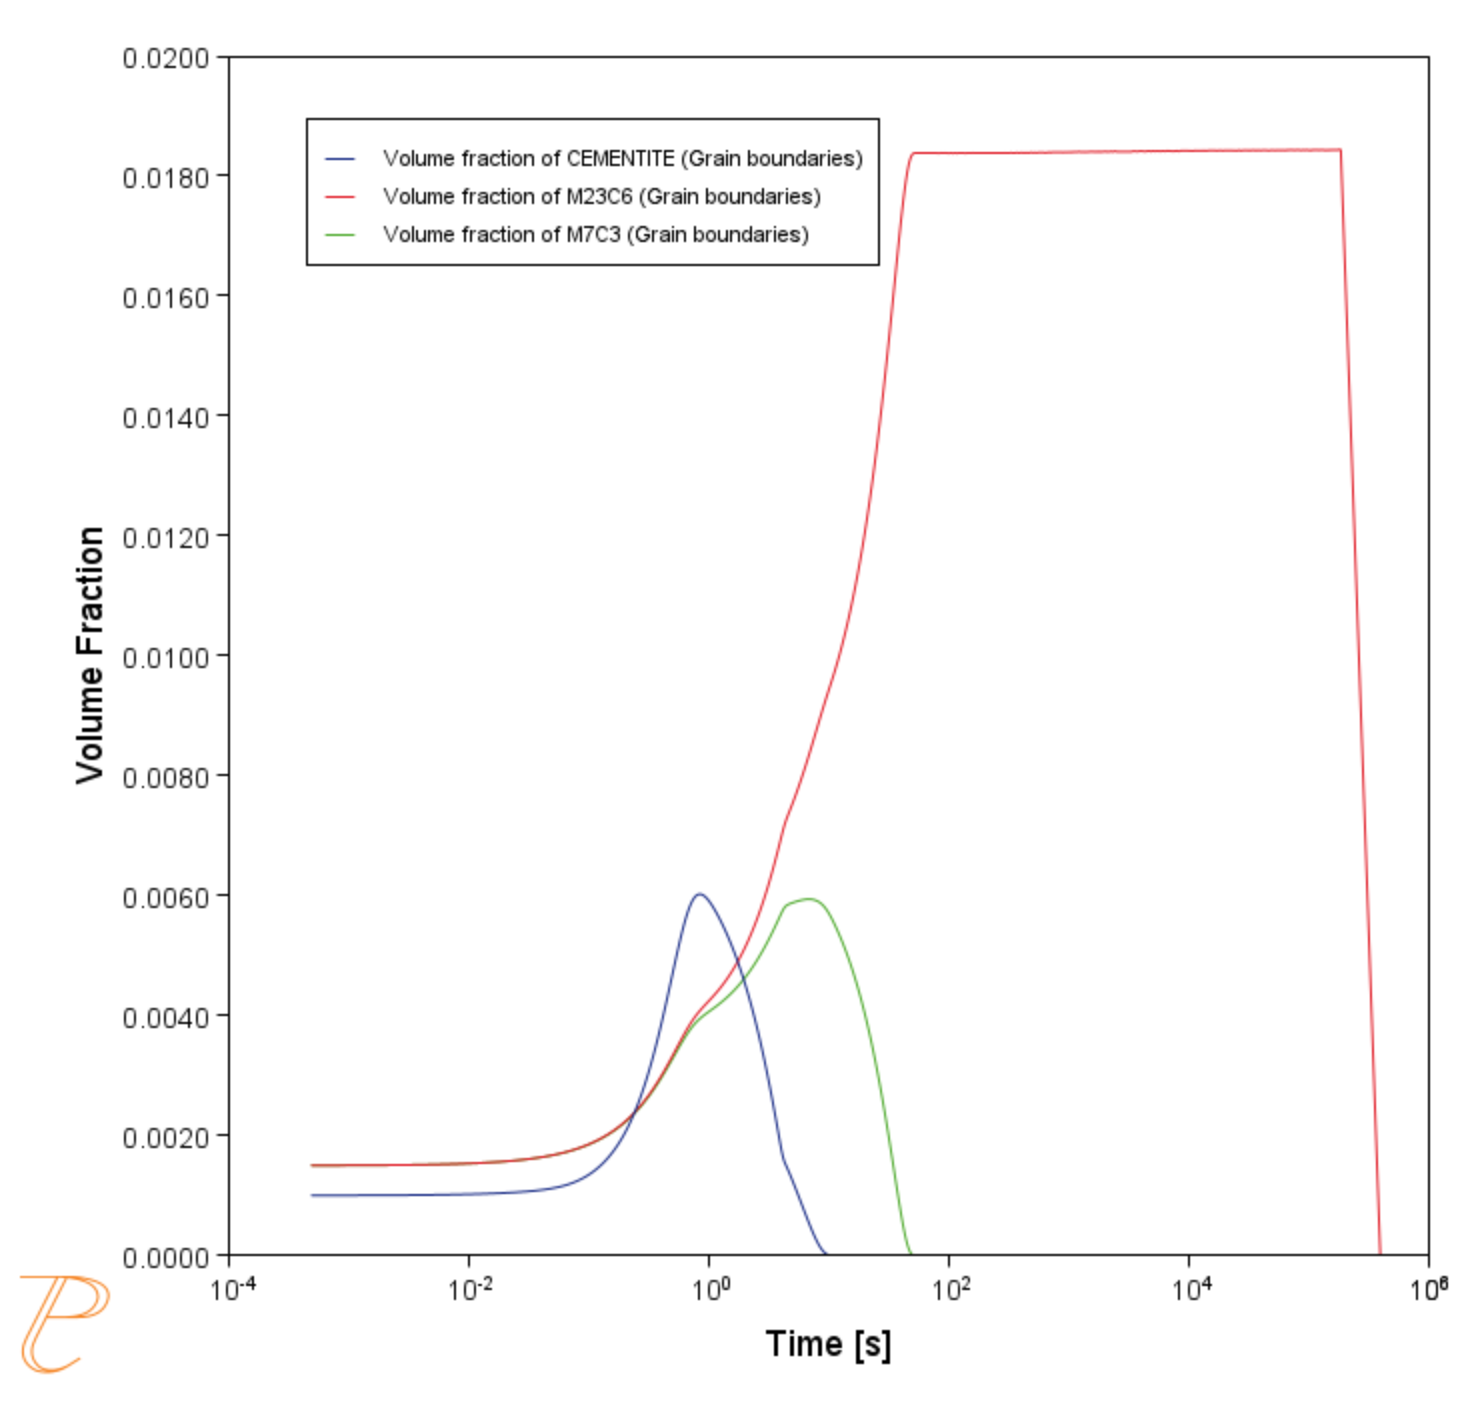
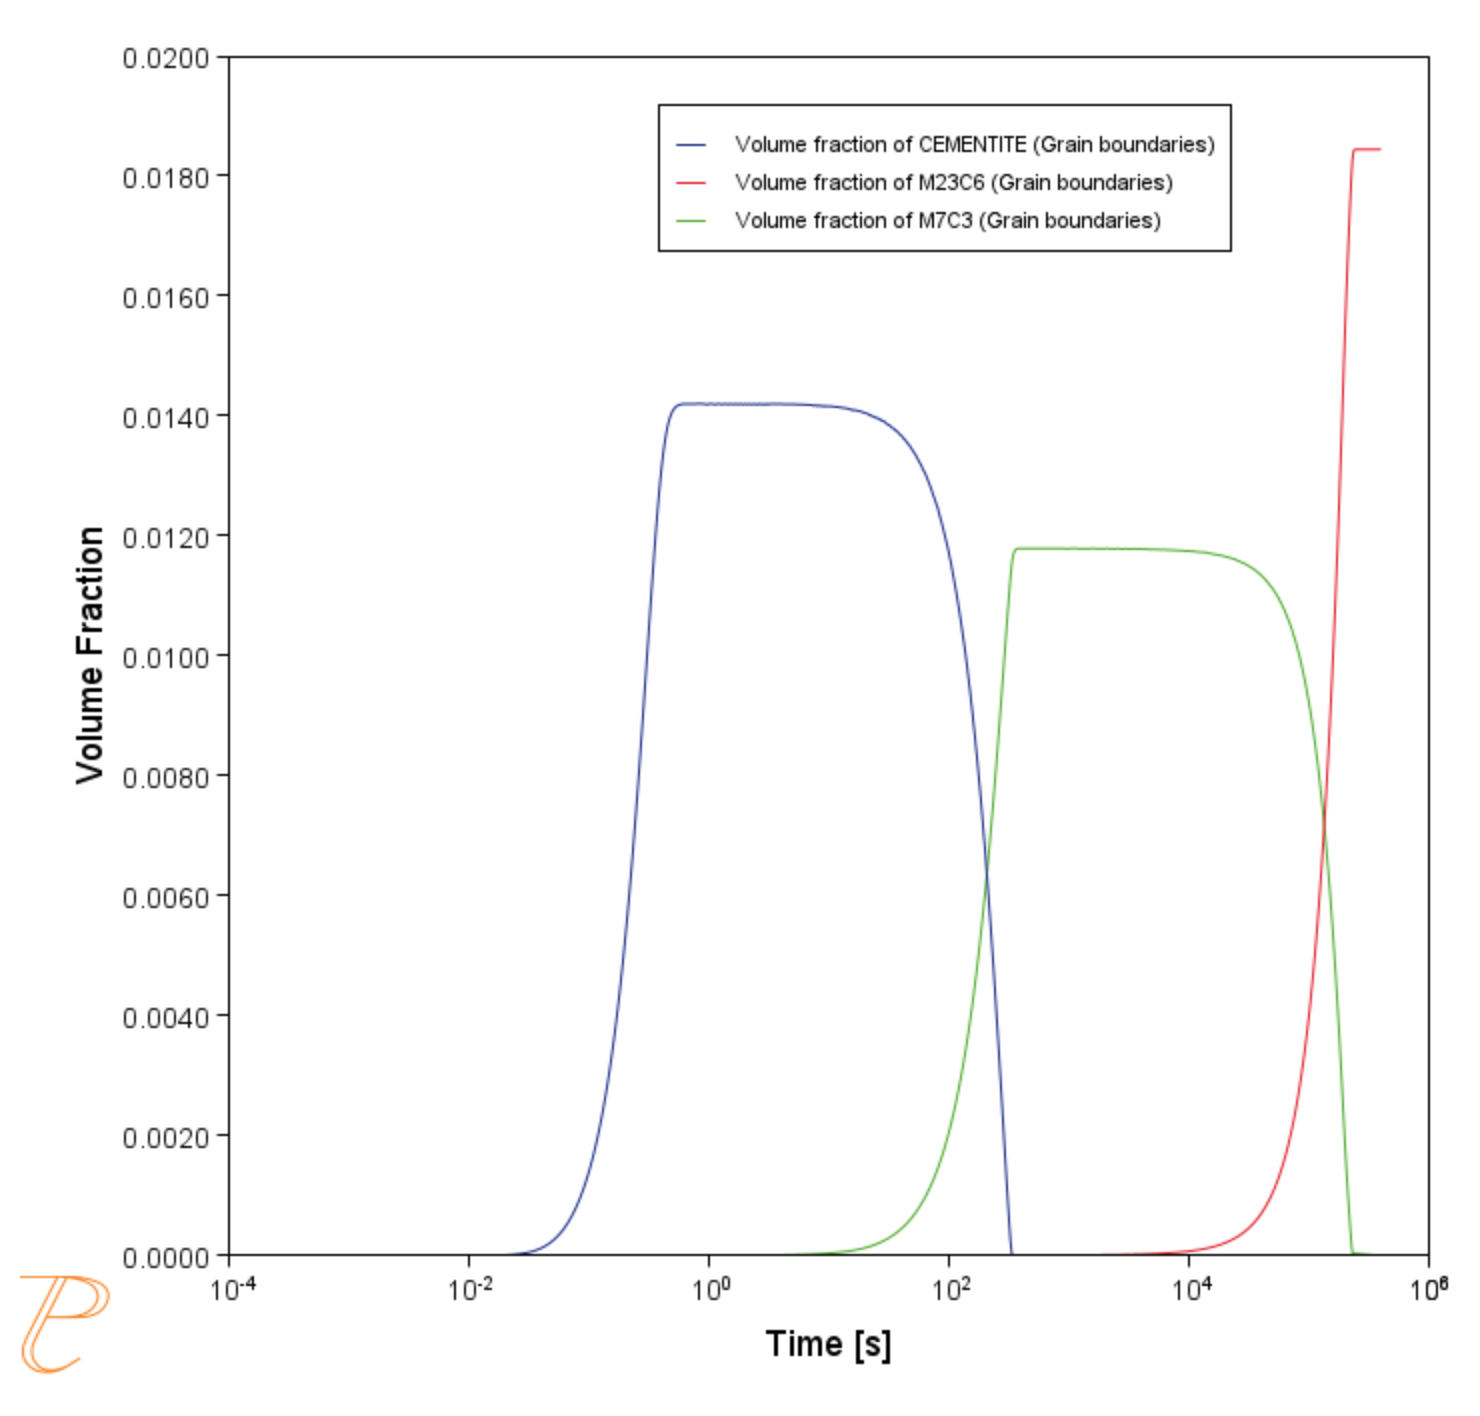
This example demonstrates the effect of initial particle size distribution (PSD) of the precipitate phases on the overall precipitation kinetics. It uses two Precipitation Calculators to simulate and compare carbide precipitations from a ferritic BCC_A2 matrix in a Fe-0.1C-12Cr alloy. Three carbides, CEMENTITE, M23C7, and M7C3 are included in the calculations simulating a complex precipitation sequence with stable and meta-stable precipitate phases. The results show a large difference in predicted behaviour, with meta-stable precipitates dissolving earlier as a result of the stable precipitates existing in the initial condition.
This example also shows the different ways to create the initial size distribution.
- Generate 3D PSD from distribution function: CEMENTITE's PSD is approximated from an LSW distribution.
- From File: M23C6's PSD is loaded from a file.
- Approximate the 3D PSD from experimental data: M7C3's PSD is approximated from 1D experimental data descriptive of halved linear intercepts.
- Folder: Precipitation Module - TC-PRISMA
- File name:
P_10_Precipitation_Initial_PSD_FeCrC.tcu
There are also two *.csv files available for you to use as a template for when you are importing data from a file.
- Input data for M23C6:
P_10_Precipitation_Initial_PSD_FeCrC_psd_3D_M23C6.csv - Input data for M7C3:
P_10_Precipitation_Initial_PSD_FeCrC_psd_1D_M7C3.csv
Preexisting Particle Size Distribution
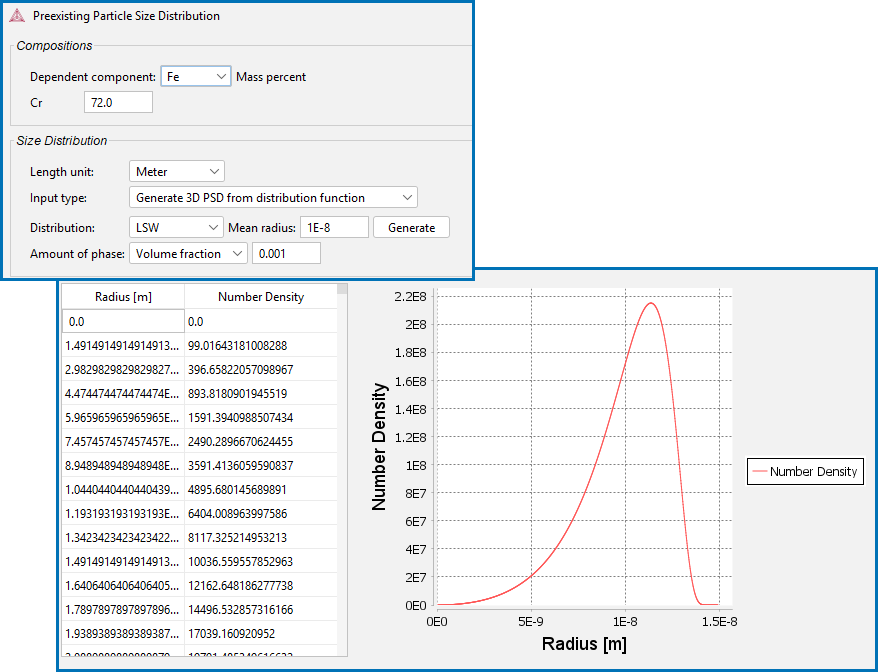
The Preexisting Particle Size Distribution window shown in Figure 1 is a graphical representation of the radius versus corresponding number densities, with fields available to enter the initial precipitate composition and volume fraction. An editable table is also provided for the particle size distribution.
Particle Size Distribution (PSD)
Cementite
The amount of Fe and Cr must be defined for Cementite for this alloy. Fe is set to the dependent component, and 72 mass percent of Cr is set. The option Generate 3D PSD from distribution function is chosen to create the PSD for Cementite. The initial volume fraction of 0.001 % is assumed. An LSW distribution is selected with a mean radius of 1E-8m.
Figure 1: An LSW distribution with a mean radius of 1E-8m is used.
M23C6
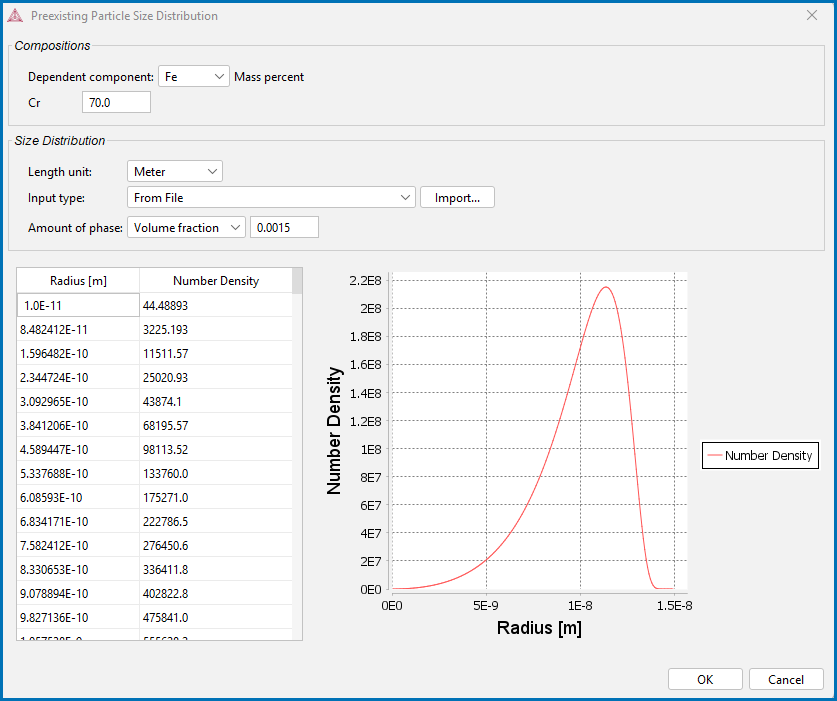
The amount of Fe and Cr must be defined for M23C6 for this alloy. Fe is set to the dependent component, and 70 mass percent of Cr is set. The From File option is used to create the PSD.
The file loaded for M23C6 is available from the Example files → Precipitation Module - TC-PRISMA folder and is named P_10_Precipitation_Initial_PSD_FeCrC_psd_3D_M23C6.csv.
You can import data from a spreadsheet or text file (.xls, .xlsx, .csv, or .txt formats are acceptable). The initial volume fraction of 0.15 % is assumed.
M7C3
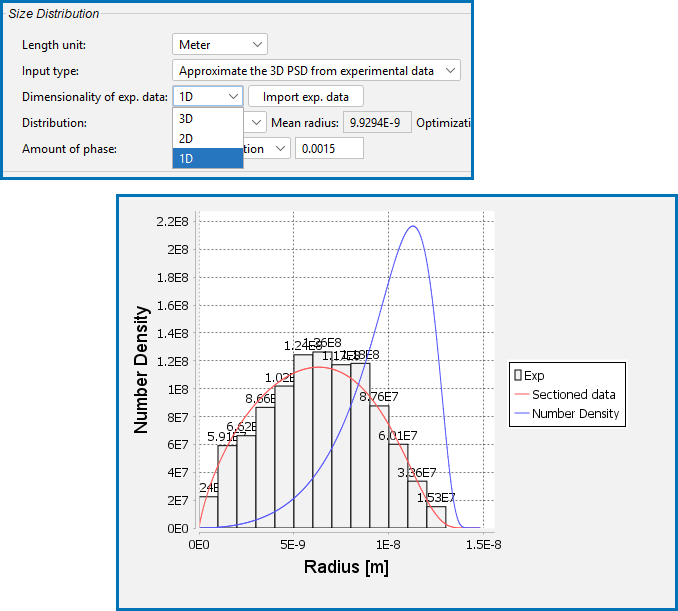
The amount of Fe and Cr must be defined for M7C3 for this alloy. Fe is set to the dependent component, and 83 mass percent of Cr is set. The Approximate the 3D PSD from experimental data option is used to create the PSD.
In this example, the linear intercept method is used to measure the size distribution of M7C3 from micrographs descriptive of sectioning the dispersion. A size distribution of halved linear intercepts is created and is available as a file you can use as a template.
The file loaded for M7C3 is available from the Example files → Precipitation Module - TC-PRISMA folder and is named P_10_Precipitation_Initial_PSD_FeCrC_psd_1D_M7C3.csv.
The Dimensionality of the exp. data is set to 1D. The experimental data is loaded by importing the above named *.csv file. An LSW Distribution is used. When you click Generate, it calibrates the chosen distribution and stereology description to the experimental data. The initial volume fraction of 0.15 % is assumed.
Example Settings
| System (System Definer) | |
| Database package | Demo: Steels and Fe-alloys (FEDEMO and MFEDEMO) |
| Elements | Fe, C, Cr |
| Conditions (Precipitation Calculator) | |
|
Composition |
Fe-0.1C-12Cr Mass percent |
|
Matrix phase |
BCC_A2 All other defaults are kept. |
|
Precipitate phases |
CEMENTITE, M23C6 and M7C3 |
| Precipitate Phase Data Parameters (Precipitation Calculator) | |
|
Nucleation sites |
Grain boundaries (all calculations): Calculated from the matrix settings with a wetting angle of 90° |
| Interfacial energy |
User-defined function f(r,T) (all calculations):
|
|
Preexisting size distribution (click Show Details to display this setting) |
For the Precipitation Calculator including particle size distribution (PSD), and for all precipitate phases, this checkbox is selected. For each precipitate phase (CEMENTITE, M23C6 and M7C3), click Edit Particle Size Distribution to make changes to the parameters. A window opens with a graphical representation of the radius vs number density. Input type
|
| Calculation Type (Precipitation Calculator) | |
| Calculation type | Isothermal |
| Temperature | 1053 K |
|
Simulation time |
400 000 seconds |
Visualizations
Many of our Graphical Mode examples have video tutorials, which you can access in a variety of ways. When in Thermo‑Calc, from the menu select Help → Video Tutorials, or from the main My Project window, click Video Tutorials. Alternately, you can go to the website or our YouTube channel.
Open the example project file to review the node setup on the Project window and the associated settings on the Configuration window for each node. For some types of projects, you can also adjust settings on the Plot Renderer Configuration window to preview results before performing the simulation. Click Perform Tree to generate plots and tables to see the results on the Visualizations window.
There is a variety of information shown in the Visualizations window that can be viewed during configuration and after performing the calculation.
- Thermal Profile: When setting up a calculator on a Configuration window for Isothermal or Non-isothermal Calculation Types, you can preview the profile and adjust settings as needed. When you click a calculator node in the Project window, the matching name of the node is on the tab(s) displayed in the Visualizations window.
For TTT Diagram and CCT Diagram calculations there is nothing shown for the Precipitation Calculator tab in the Visualizations window as there is no Thermal Profile to be defined.
- Plot or Table results: After completing the set up and performing the calculation, to view the matching name of the node on tab(s) in the Visualizations window, either click a Plot Renderer or Table Renderer node in the Project window or click the tabs individually in the Visualizations window.
For this Isothermal example, its Thermal Profile is also displayed in the Visualizations window showing the constant temperature entered for this calculation type. The tab names match the node names in the Project window.
Figure 2: These results show the predicted volume fraction of cementite, M23C6, and M7C3 during an isothermal aging with an initial particle size distribution of each precipitate phase. The predicted kinetics are sensitive to the initial size, volume fraction, and composition of these precipitates.
