P_09: Precipitation of Al-Sc AL3SC with Assumption of Sphere and Cuboid Morphologies
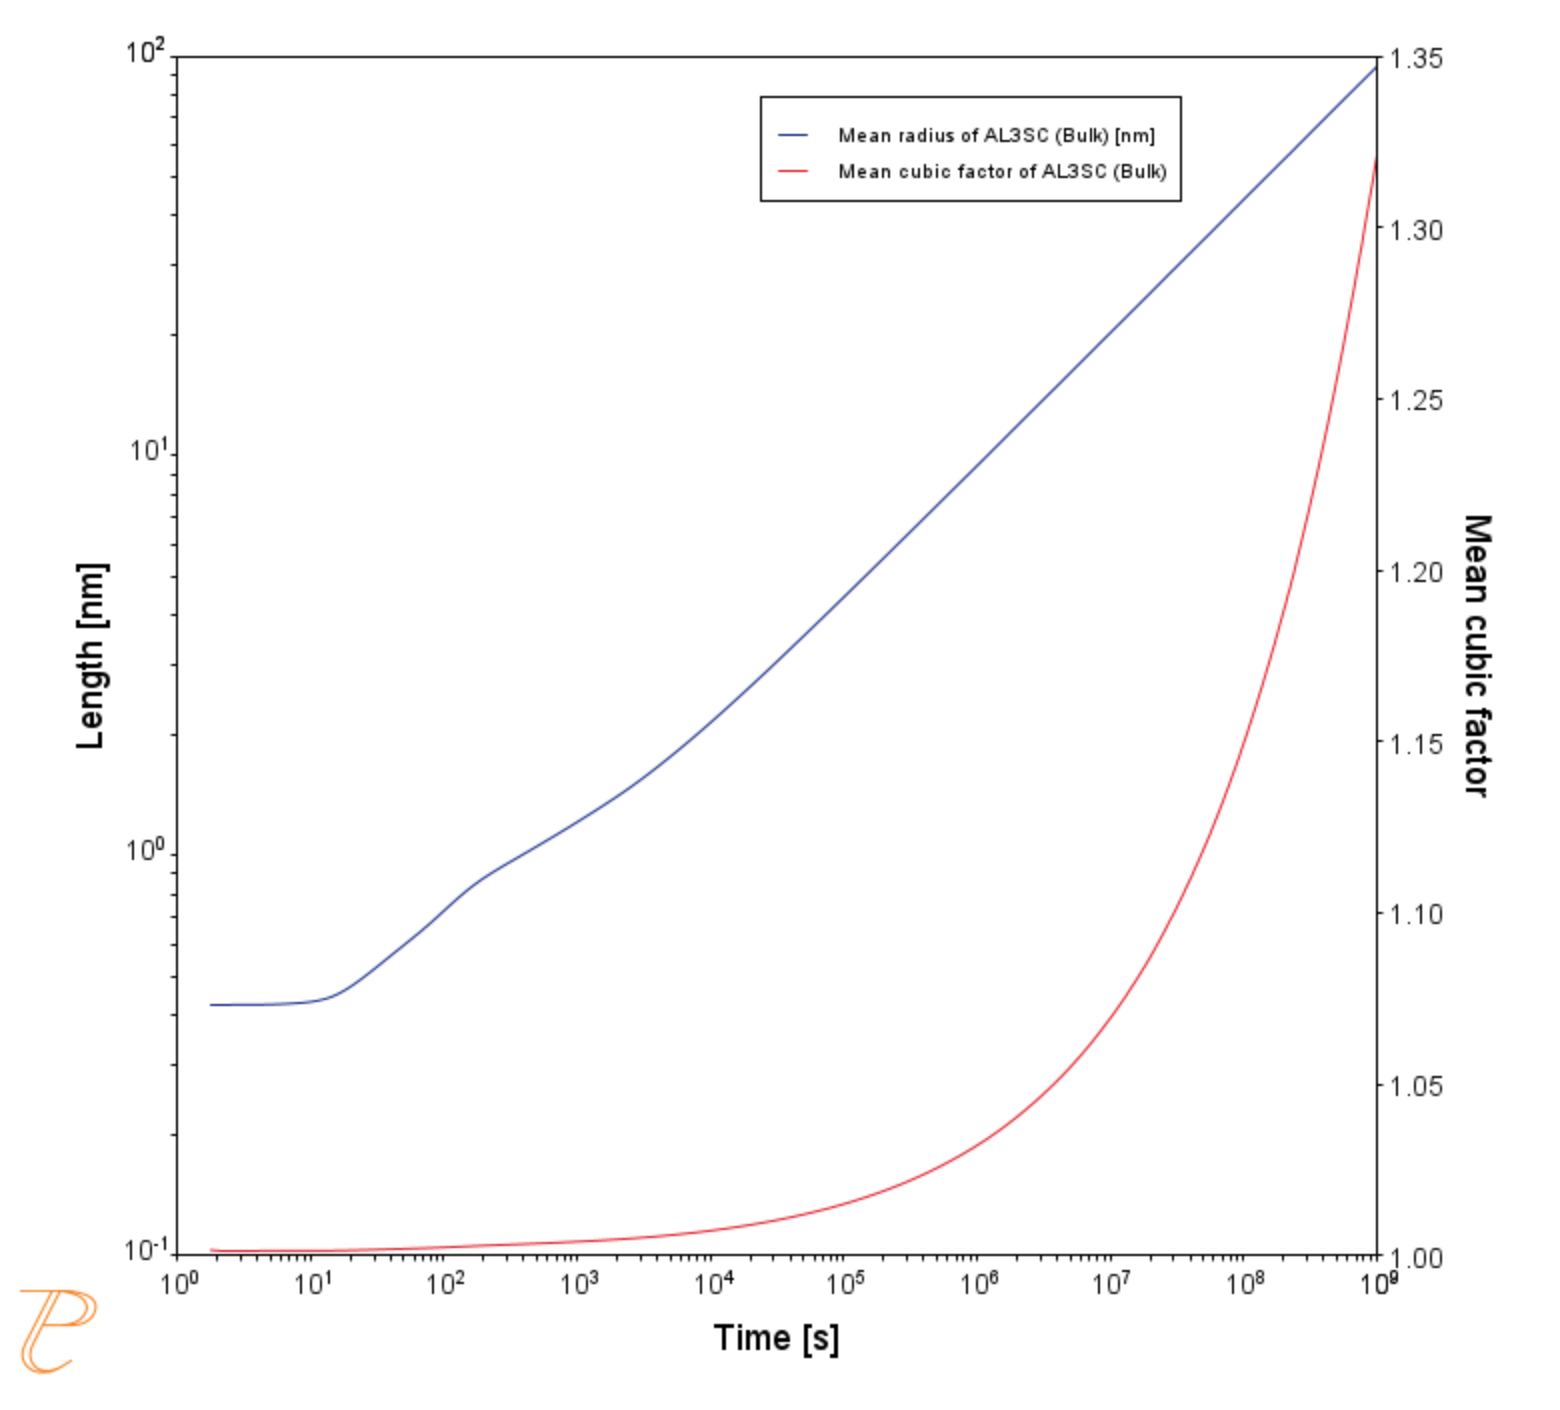
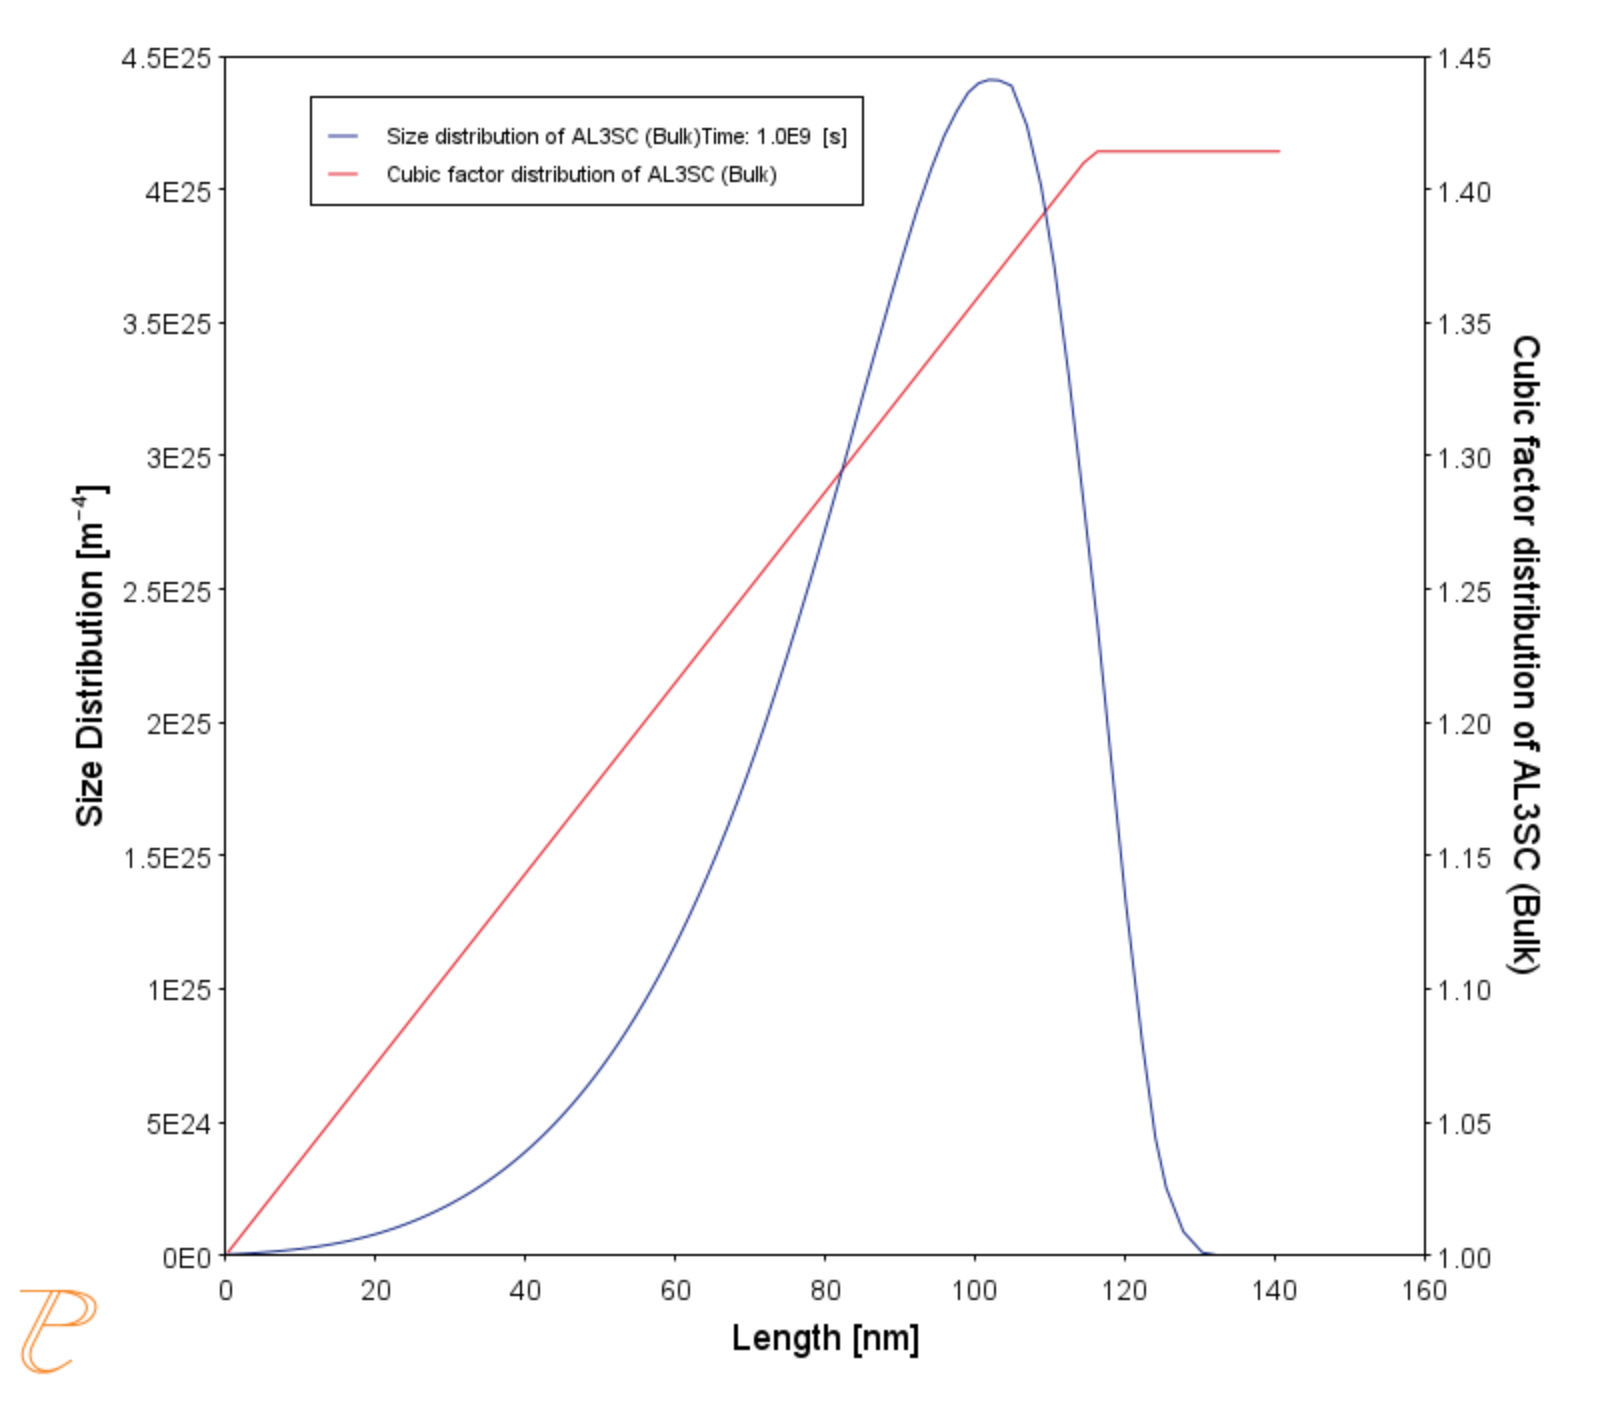
In this isothermal calculation example, the precipitation of Al3Sc phase from FCC_A1 matrix phase in an Al-Sc binary alloy is simulated. To make a comparison, two separate calculations are performed, one assuming spherical morphology without elastic strain energy, and the other assuming cuboid morphology whose shape is determined by competition between interfacial energy and elastic strain energy. The simulation results are compared with experimental data collected from Marquis and Seidman [2001Mar] and Novotny and Ardell [2001Nov]. In addition, mean cubic factor and cubic factor distribution are also plotted for cuboid shape to illustrate the spherical-cuboidal transition during precipitation.
For more details about the background theory, see Precipitation Morphology.
- Folder: Precipitation Module - TC-PRISMA
- File name:
P_09_Precipitation_Al-Sc_AL3SC_Sphere_Cuboid.tcu
Example Settings
To ensure that the settings are done on the correct Precipitation Calculators, the Sphere and Cuboid nodes are renamed from Precipitation Calculator to match their morphology. The morphology is set in the Precipitate Phase section when you click Show Details. See P_08 for an example of this.
| System (System Definer) | |
| Database package |
Demo: Aluminum-based alloys (ALDEMO, MALDEMO) |
| Elements |
Al, Sc |
| Sphere and Cuboid Conditions (Precipitation Calculator) | |
|
Composition |
Al-0.18Sc Mole percent |
|
Matrix phase |
FCC_A1 |
|
Precipitate phase |
AL3SC |
| Matrix Phase Data Parameters (Precipitation Calculator) | |
| Elastic properties (click Show Details to display this setting) |
For the Sphere node (renamed from Precipitation Calculator), the default, Disregard is kept. For the Cuboid node (renamed from Precipitation Calculator), choose Cubic. Then enter the elastic constants accordingly. Default elastic constants are given based on the major element of the alloy system. In this example that is
|
| Precipitate Phase Data Parameters (Precipitation Calculator) | |
|
Nucleation sites |
Bulk |
| Interfacial energy |
The default |
| Morphology (click Show Details to display this setting) |
For the Sphere node (renamed from Precipitation Calculator), keep the default. For the Cuboid node (renamed from Precipitation Calculator), Cuboid is selected. |
|
Transformation strain (click Show Details to display this setting) |
For the Sphere node (renamed from Precipitation Calculator), keep the default. For the Cuboid node (renamed from Precipitation Calculator), Calculate from molar volume is selected to obtain a purely dilatational strain. |
| Calculation Type (Precipitation Calculator) | |
| Calculation type |
Isothermal |
| Temperature |
350° C |
|
Simulation time |
1.0E9 seconds |
| Datasets (Experimental File Reader) | |
| Dataset 1 and Dataset 2 | Data sets included with this example and imported to one Experimental File Reader. It is used for the Mean Radius plot. |
Visualizations
This example is included as a Precipitation Module (TC-PRISMA) tutorial on our website and as part of the playlist on our YouTube channel.
Open the example project file to review the node setup on the Project window and the associated settings on the Configuration window for each node. For some types of projects, you can also adjust settings on the Plot Renderer Configuration window to preview results before performing the simulation. Click Perform Tree to generate plots and tables to see the results on the Visualizations window.
There is a variety of information shown in the Visualizations window that can be viewed during configuration and after performing the calculation.
- Thermal Profile: When setting up a calculator on a Configuration window for Isothermal or Non-isothermal Calculation Types, you can preview the profile and adjust settings as needed. When you click a calculator node in the Project window, the matching name of the node is on the tab(s) displayed in the Visualizations window.
For TTT Diagram and CCT Diagram calculations there is nothing shown for the Precipitation Calculator tab in the Visualizations window as there is no Thermal Profile to be defined.
- Plot or Table results: After completing the set up and performing the calculation, to view the matching name of the node on tab(s) in the Visualizations window, either click a Plot Renderer or Table Renderer node in the Project window or click the tabs individually in the Visualizations window.
In this example, all nodes are renamed in the Project window, and this matches each of the tab names in the Visualizations window.
For this Isothermal example, its Thermal Profile is also displayed in the Visualizations window showing the constant temperature entered for this calculation type. The tab names match the node names in the Project window.
Figure 1: This shows the predicted evolution of the mean size of precipitates with the experimental data from [2001Mar, 2001Nov], comparing the spherical and cuboidal shaped approximations of the precipitate morphology. Although there is not significant difference in the results, capturing the correct geometry of the precipitate is important in subsequent calculations of precipitate spacing used in property calculations.
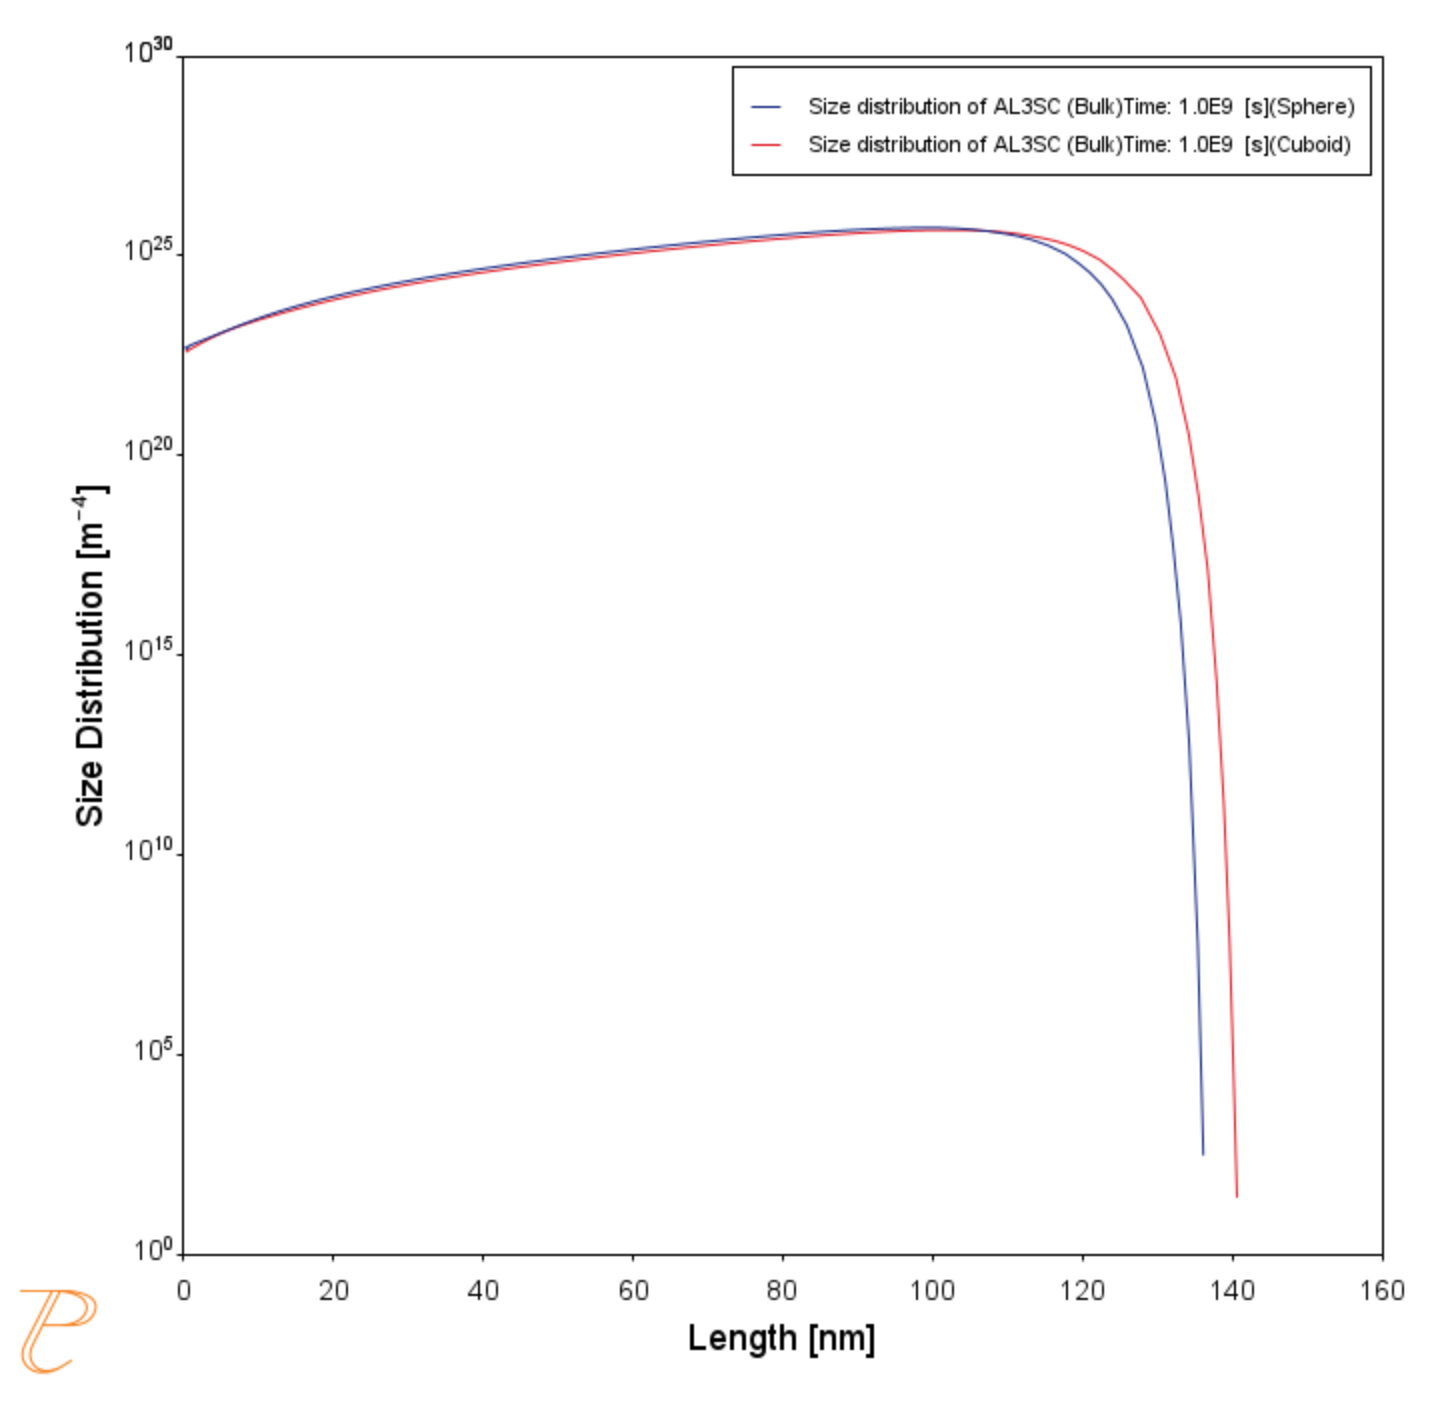
Figure 2: These results compare the predicted size distributions after heat treatment considering the spherical and cuboidal approximations of the precipitate morphology.
Figure 3: These results compare the predicted evolution of the mean particle radius and mean aspect ratio from using the cuboidal approximation of the precipitate morphology. In this case, the radius of a sphere of equivalent volume to the cuboidal precipitate is shown.
Figure 4: These results show the predicted size distribution of the precipitates obtained from the cuboidal approximation of the precipitate morphology. Also shown is the calculated size dependent cubic factor of the cuboids associated with this dispersion.
References
[2001Mar] E. A. Marquis, D. N. Seidman, Nanoscale structural evolution of Al3Sc precipitates in Al(Sc) alloys. Acta Mater. 49, 1909–1919 (2001).
[2001Nov] G. M. Novotny, A. J. Ardell, Precipitation of Al3Sc in binary Al–Sc alloys. Mater. Sci. Eng. A Struct. Mater. Prop. Microstruct. Process. 318, 144–154 (2001).
![This shows the predicted evolution of the mean size of precipitates with the experimental data from [2001Mar, 2001Nov], comparing the spherical and cuboidal shaped approximations of the precipitate morphology. This shows the predicted evolution of the mean size of precipitates with the experimental data from [2001Mar, 2001Nov], comparing the spherical and cuboidal shaped approximations of the precipitate morphology.](../../resources/images/tc-prisma/examples/p-09 mean radius.png)


