P_07: Continuous Cooling Transformation (CCT) Diagram of Ni-Al-Cr γ-γ’
This example shows you how to simulate a CCT (Continuous Cooling Transformation) diagram for gamma prime (γ’) precipitation in a Ni-Cr-Al alloy using the Precipitation Calculator. A CCT calculation maintains the same cooling rate the entire time.
The system is a Ni-10Al-10Cr γ - γ’ alloy and it is calculated and plotted with superimposition of the cooling rate values.
- Folder: Precipitation Module - TC-PRISMA
- File name:
P_07_Precipitation_Ni-Al-Cr_CCT_Gamma-Gamma_prime.tcu
Example Settings
| System (System Definer) | |
| Database package |
Demo: Nickel-based Super Alloys (NIDEMO and MNIDEMO) |
| Elements |
Ni, Al, Cr |
| Conditions (Precipitation Calculator) | |
| Composition |
Ni-10Al-10Cr Mole percent |
| Matrix phase |
DIS_FCC_A1 |
| Precipitate phase |
FCC_L12#2 |
| Precipitate Phase Data Parameters (Precipitation Calculator) | |
| Nucleation sites |
Bulk |
| Interfacial energy | 0.023 J/m2 |
| Calculation Type (Precipitation Calculator) | |
| Calculation type |
CCT Diagram |
| Temperature Min to Max |
500 to 1200 Kelvin |
| Cooling rate(s) |
.01 .1 1 10 100 K/s |
| Stop criteria |
Volume fraction of phase 1.0E-4 |
Visualizations
This example is included as a Precipitation Module (TC-PRISMA) tutorial on our website and as part of the playlist on our YouTube channel.
Open the example project file to review the node setup on the Project window and the associated settings on the Configuration window for each node. For some types of projects, you can also adjust settings on the Plot Renderer Configuration window to preview results before performing the simulation. Click Perform Tree to generate plots and tables to see the results on the Visualizations window.
When you run (Perform) this example, it takes a few minutes for the calculations to complete.
There is a variety of information shown in the Visualizations window that can be viewed during configuration and after performing the calculation.
- Thermal Profile: When setting up a calculator on a Configuration window for Isothermal or Non-isothermal Calculation Types, you can preview the profile and adjust settings as needed. When you click a calculator node in the Project window, the matching name of the node is on the tab(s) displayed in the Visualizations window.
For TTT Diagram and CCT Diagram calculations there is nothing shown for the Precipitation Calculator tab in the Visualizations window as there is no Thermal Profile to be defined.
- Plot or Table results: After completing the set up and performing the calculation, to view the matching name of the node on tab(s) in the Visualizations window, either click a Plot Renderer or Table Renderer node in the Project window or click the tabs individually in the Visualizations window.
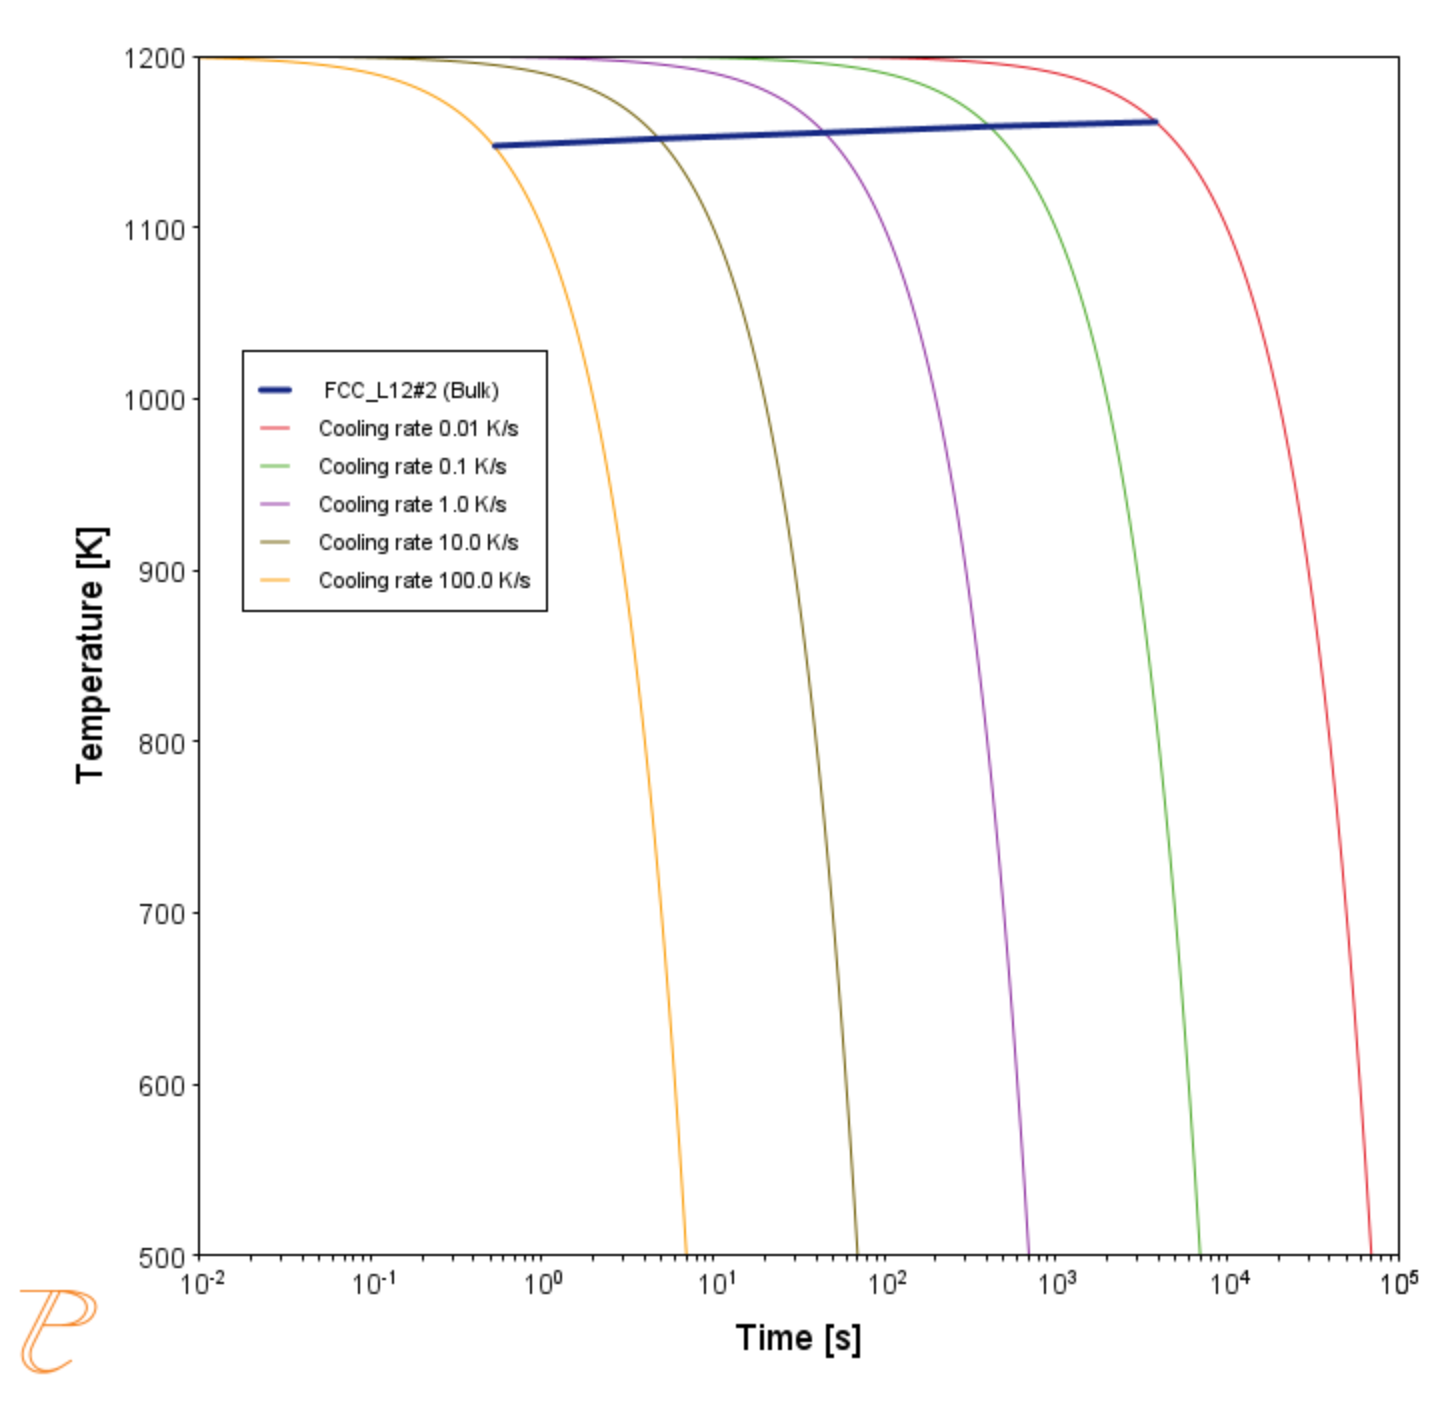
Figure 1: In this plot, the blue horizontal line shows the time it takes for γ’ to transform at each of the cooling rates according to the stop criteria, which is set as 1e-4 volume fraction. The cooling rates are represented by the multicoloured curved lines.
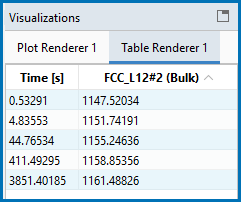
If you hover your mouse over the intersection of the blue line and any of the vertical lines, a yellow box shows the approximate time it takes for γ’ to transform according to the stop criteria, which is a volume fraction of 1e-4, followed by the approximate temperature.

