P_06: Precipitation of γ’ in Ni Superalloys - Non-isothermal
This example simulates the kinetics of precipitation of gamma prime (γ’) phase from gamma (γ) phase in Ni-8Al-8Cr and Ni-10Al-10Cr at.% alloys during continuous cooling from a super-solvus temperature. The simulation results can be compared with experimental results from Rojhirunsakool et al. [2013Roj].
DIS_FCC_A1 needs to be selected on the System Definer for both the thermodynamic and mobility databases.
- Folder: Precipitation Module - TC-PRISMA
- File name:
P_06_Precipitation_Ni-Al-Cr_Non-isothermal_Gamma-Gamma_prime.tcu
Example Settings
| System (System Definer) | |
| Database package | Demo: Nickel-based Super Alloys (NIDEMO and MNIDEMO) |
| Elements | Ni, Al, Cr |
| Conditions (Precipitation Calculator) | |
| Composition (Ni-8Al-8Cr) | Ni-8Al-8Cr Mole percent |
| Composition (Ni-10Al-10Cr) | Ni-10Al-10Cr Mole percent |
| Matrix phase |
DIS_FCC_A1 |
| Precipitate phase | FCC_L12#2 |
| Matrix Phase Data Parameters (Precipitation Calculator) | |
| Mobility adjustment > Prefactor (click Show Details to display this setting) | Keep the default, Same for all elements, then enter 5.0 for the Prefactor. |
| Precipitate Phase Data Parameters (Precipitation Calculator) | |
| Nucleation sites | Bulk |
| Interfacial energy | 0.023 J/m2 |
| Calculation Type (Precipitation Calculator) | |
| Calculation type | Non-isothermal |
| Temperature unit | Celsius |
| Time unit | Seconds |
|
Temperature |
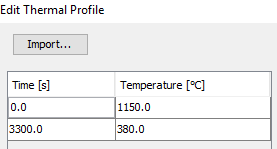
1150 - 380 °C |
| Simulation time (Ni-8Al-8Cr) | 3300 s |
| Simulation time (Ni-10Al-10Cr) | 3300 s |
| Multimodal PSD (Plot Renderer) | |
| Separate multimodal PSD checkbox is selected for 8Al-8Cr for both the Mean radius and PSD plots. |
|
| Separate multimodal PSD checkbox is selected for 10Al-10Cr for both the Mean radius and PSD plots. |
|
Visualizations
Many of our Graphical Mode examples have video tutorials, which you can access in a variety of ways. When in Thermo‑Calc, from the menu select Help → Video Tutorials, or from the main My Project window, click Video Tutorials. Alternately, you can go to the website or our YouTube channel.
Open the example project file to review the node setup on the Project window and the associated settings on the Configuration window for each node. For some types of projects, you can also adjust settings on the Plot Renderer Configuration window to preview results before performing the simulation. Click Perform Tree to generate plots and tables to see the results on the Visualizations window.
When you run (Perform) this example, it takes a few minutes for the calculations to complete.
There is a variety of information shown in the Visualizations window that can be viewed during configuration and after performing the calculation.
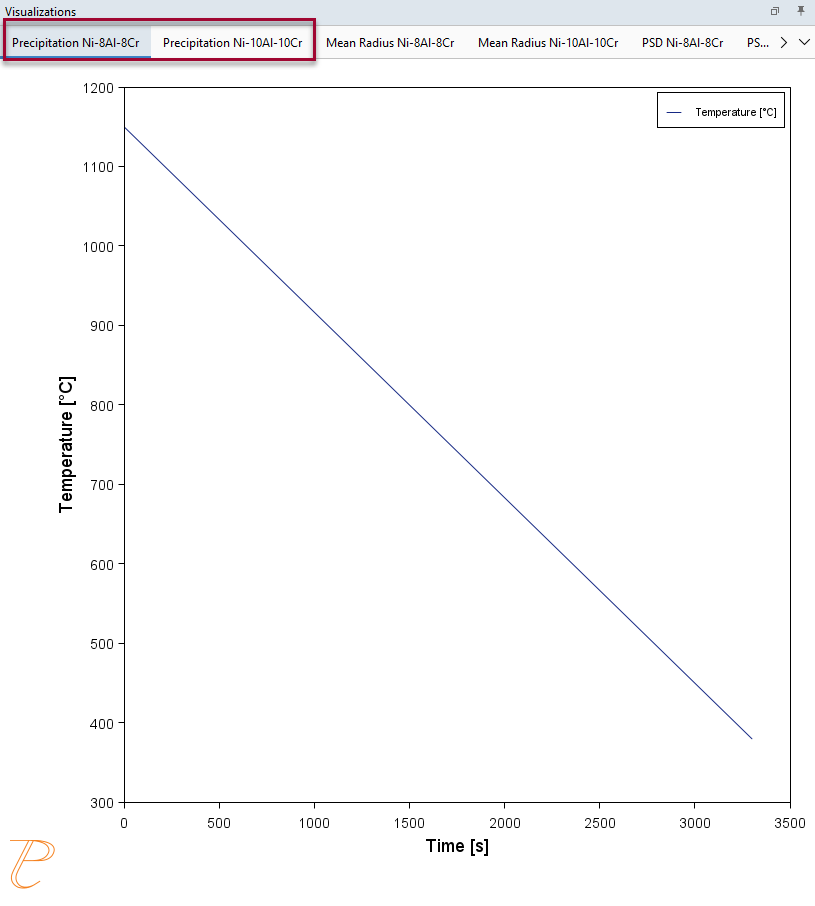
- Thermal Profile: When setting up a calculator on a Configuration window for Isothermal or Non-isothermal Calculation Types, you can preview the profile and adjust settings as needed. When you click a calculator node in the Project window, the matching name of the node is on the tab(s) displayed in the Visualizations window.
For TTT Diagram and CCT Diagram calculations there is nothing shown for the Precipitation Calculator tab in the Visualizations window as there is no Thermal Profile to be defined.
- Plot or Table results: After completing the set up and performing the calculation, to view the matching name of the node on tab(s) in the Visualizations window, either click a Plot Renderer or Table Renderer node in the Project window or click the tabs individually in the Visualizations window.
In this example, all nodes are renamed in the Project window, and this matches each of the tab names in the Visualizations window.
Figure 1: During set up of the calculation, you can preview the non-isothermal Thermal Profile(s). Click the tab in the Visualizations window to adjust settings on the Precipitation Calculator Configuration window. In this case the heat treatment is a continuous cooling curve, however any thermal profile can be modeled using the Non-isothermal Calculation Type.
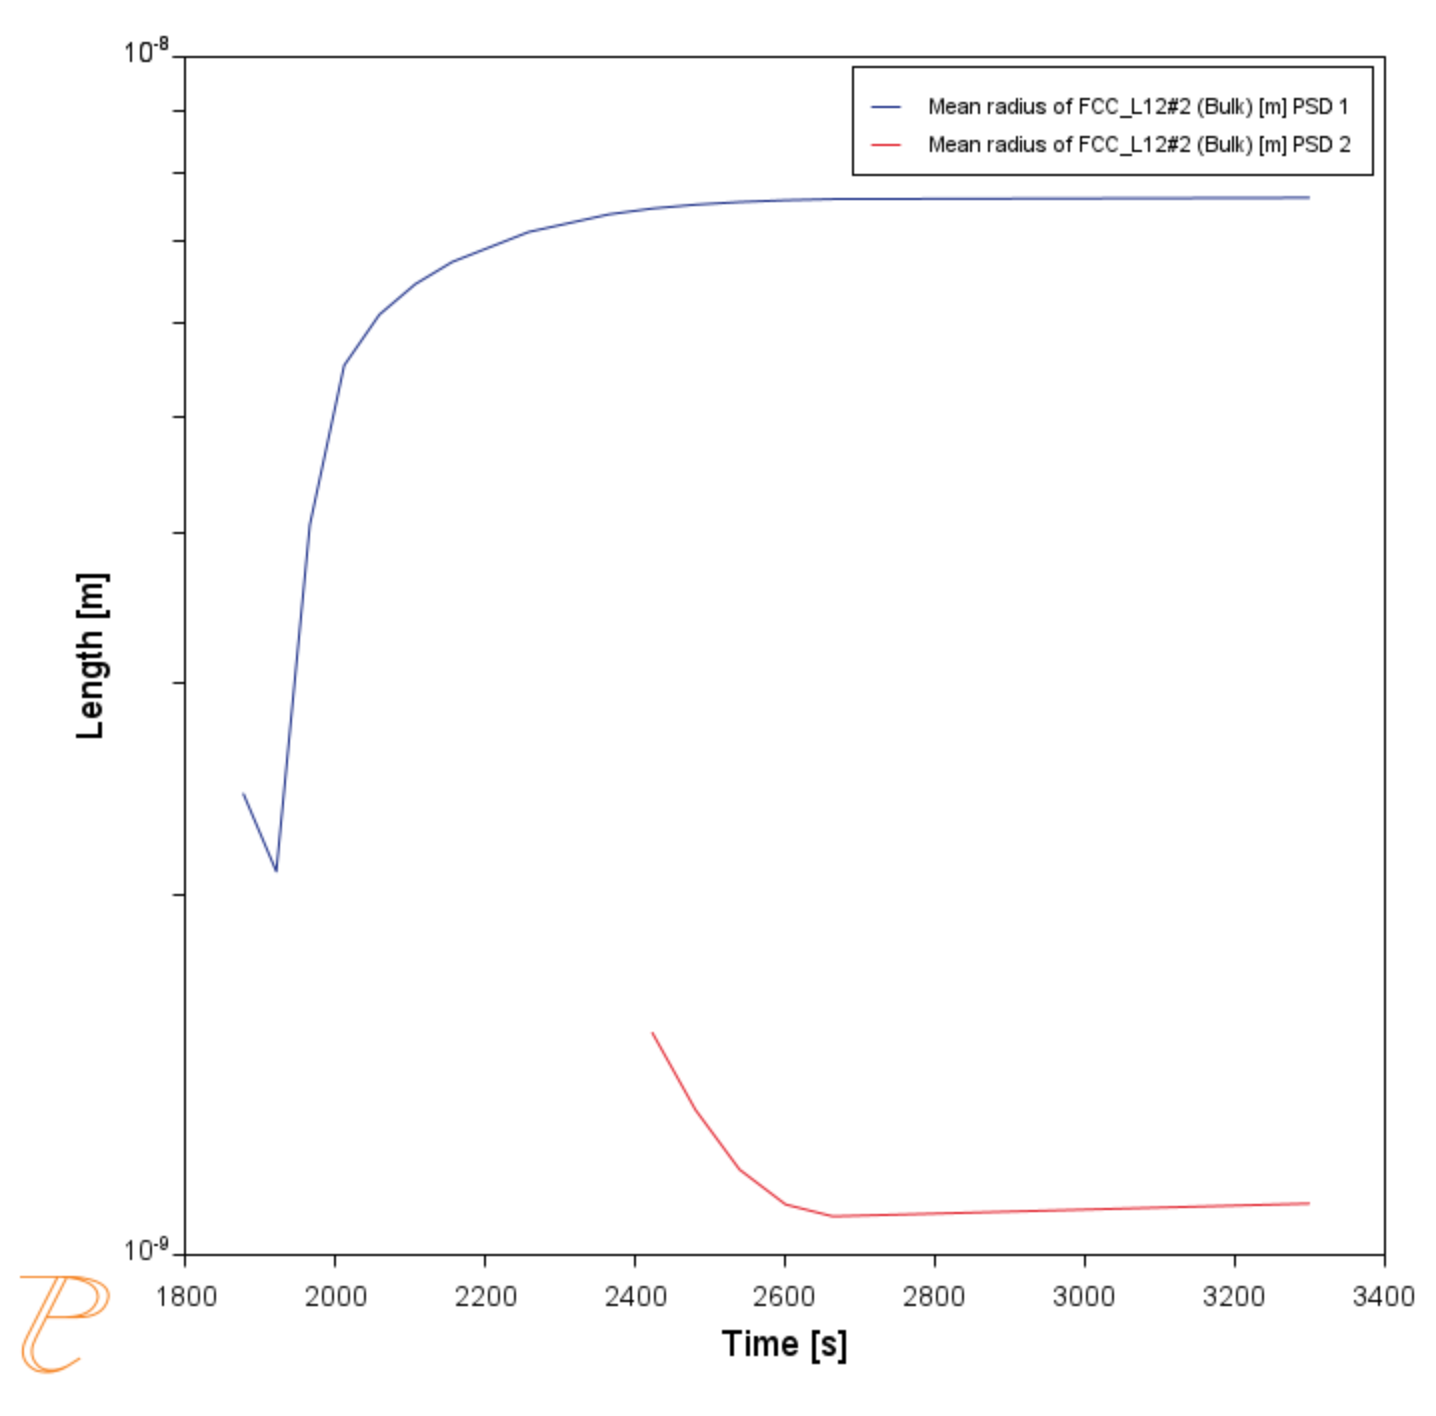
Figure 2: These results show the predicted evolution of the mean radius of gamma prime populations nucleating during the quench for the Ni-8Al-8Cr alloy. Note that the tertiary particles (second particle population) are very small, and this dispersion would appear monomodal without TEM characterization.
Figure 3: These results show the predicted evolution of the mean radius of gamma prime populations nucleating during the quench for the Ni-10Al-10Cr alloy. In this case three distinct particle populations are simulated to form, agreeing with [2013Roj].
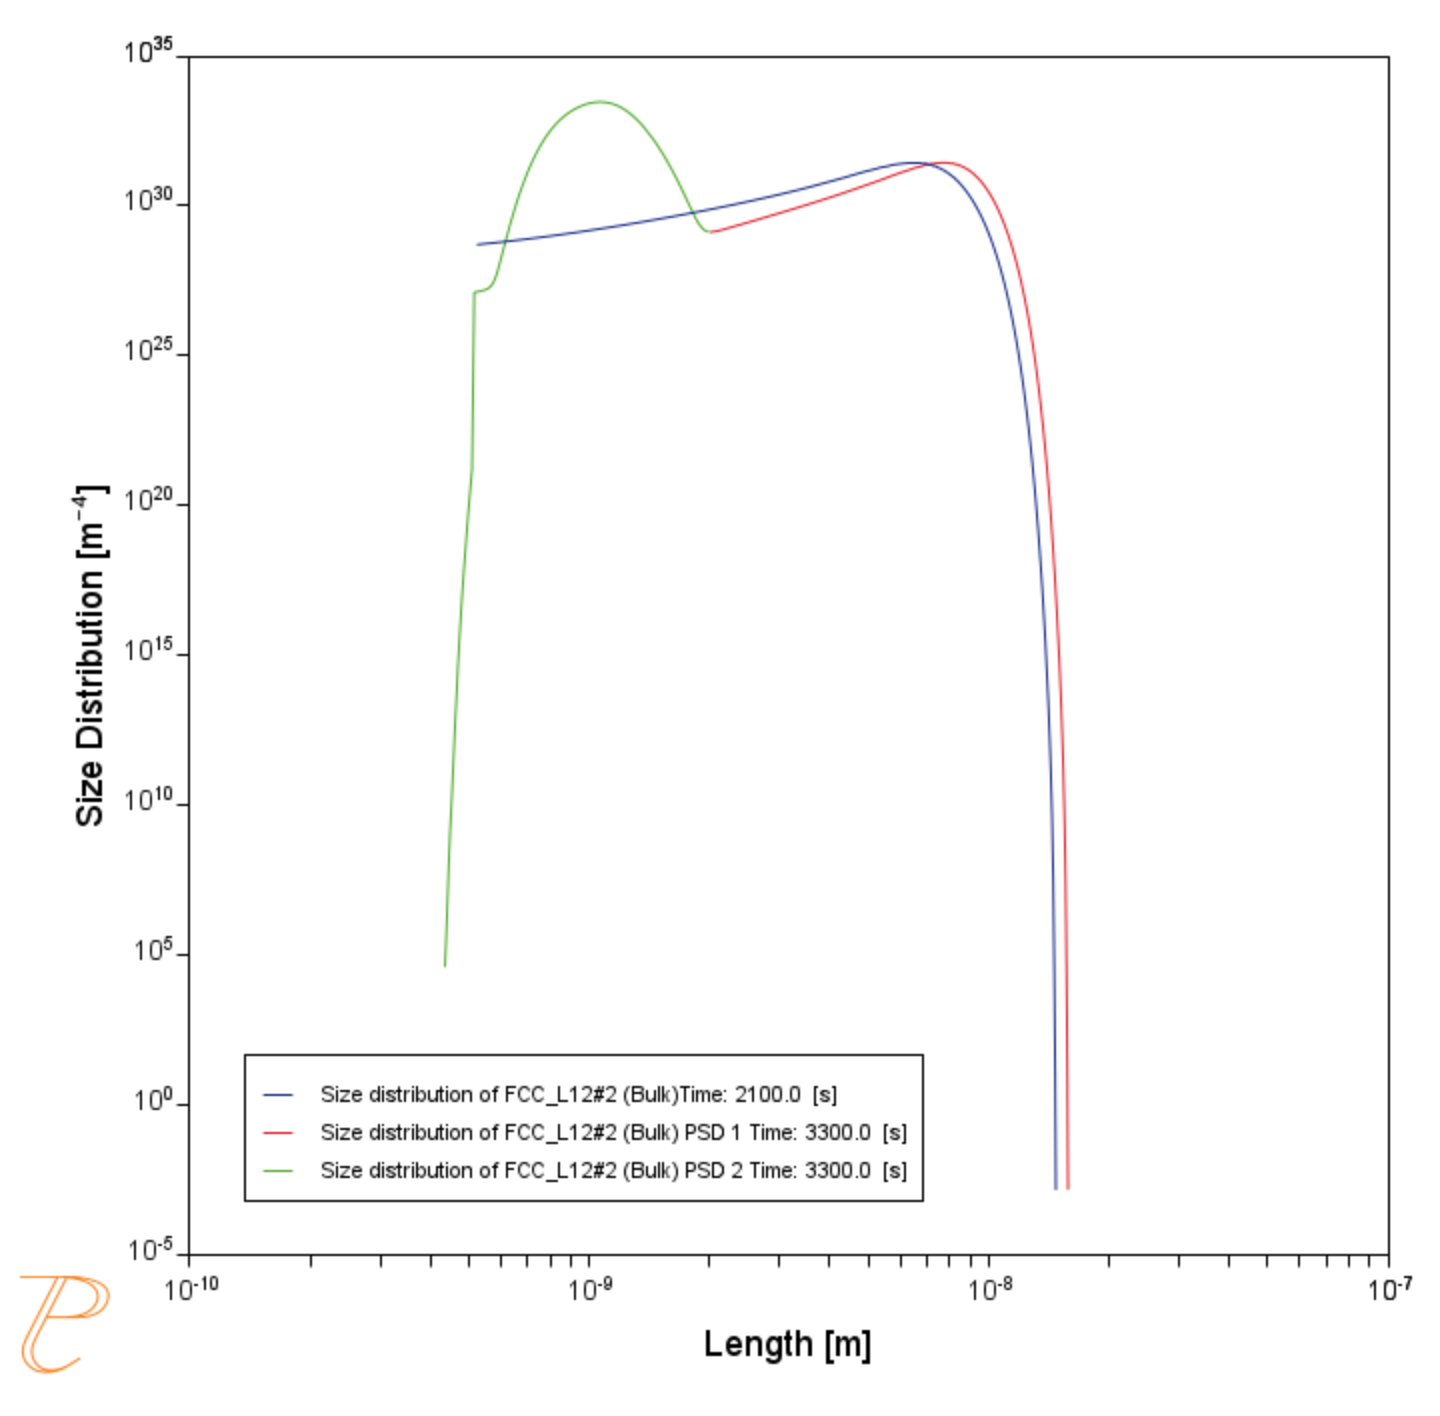
Figure 4: These results show the predicted size distributions of precipitates at different times during the quench of the for the Ni-8Al-8Cr alloy. The individual particle populations are distinguished using the “Separate multimodal PSD” option showing a bimodal distribution with very small nano-meter sized tertiary particles.
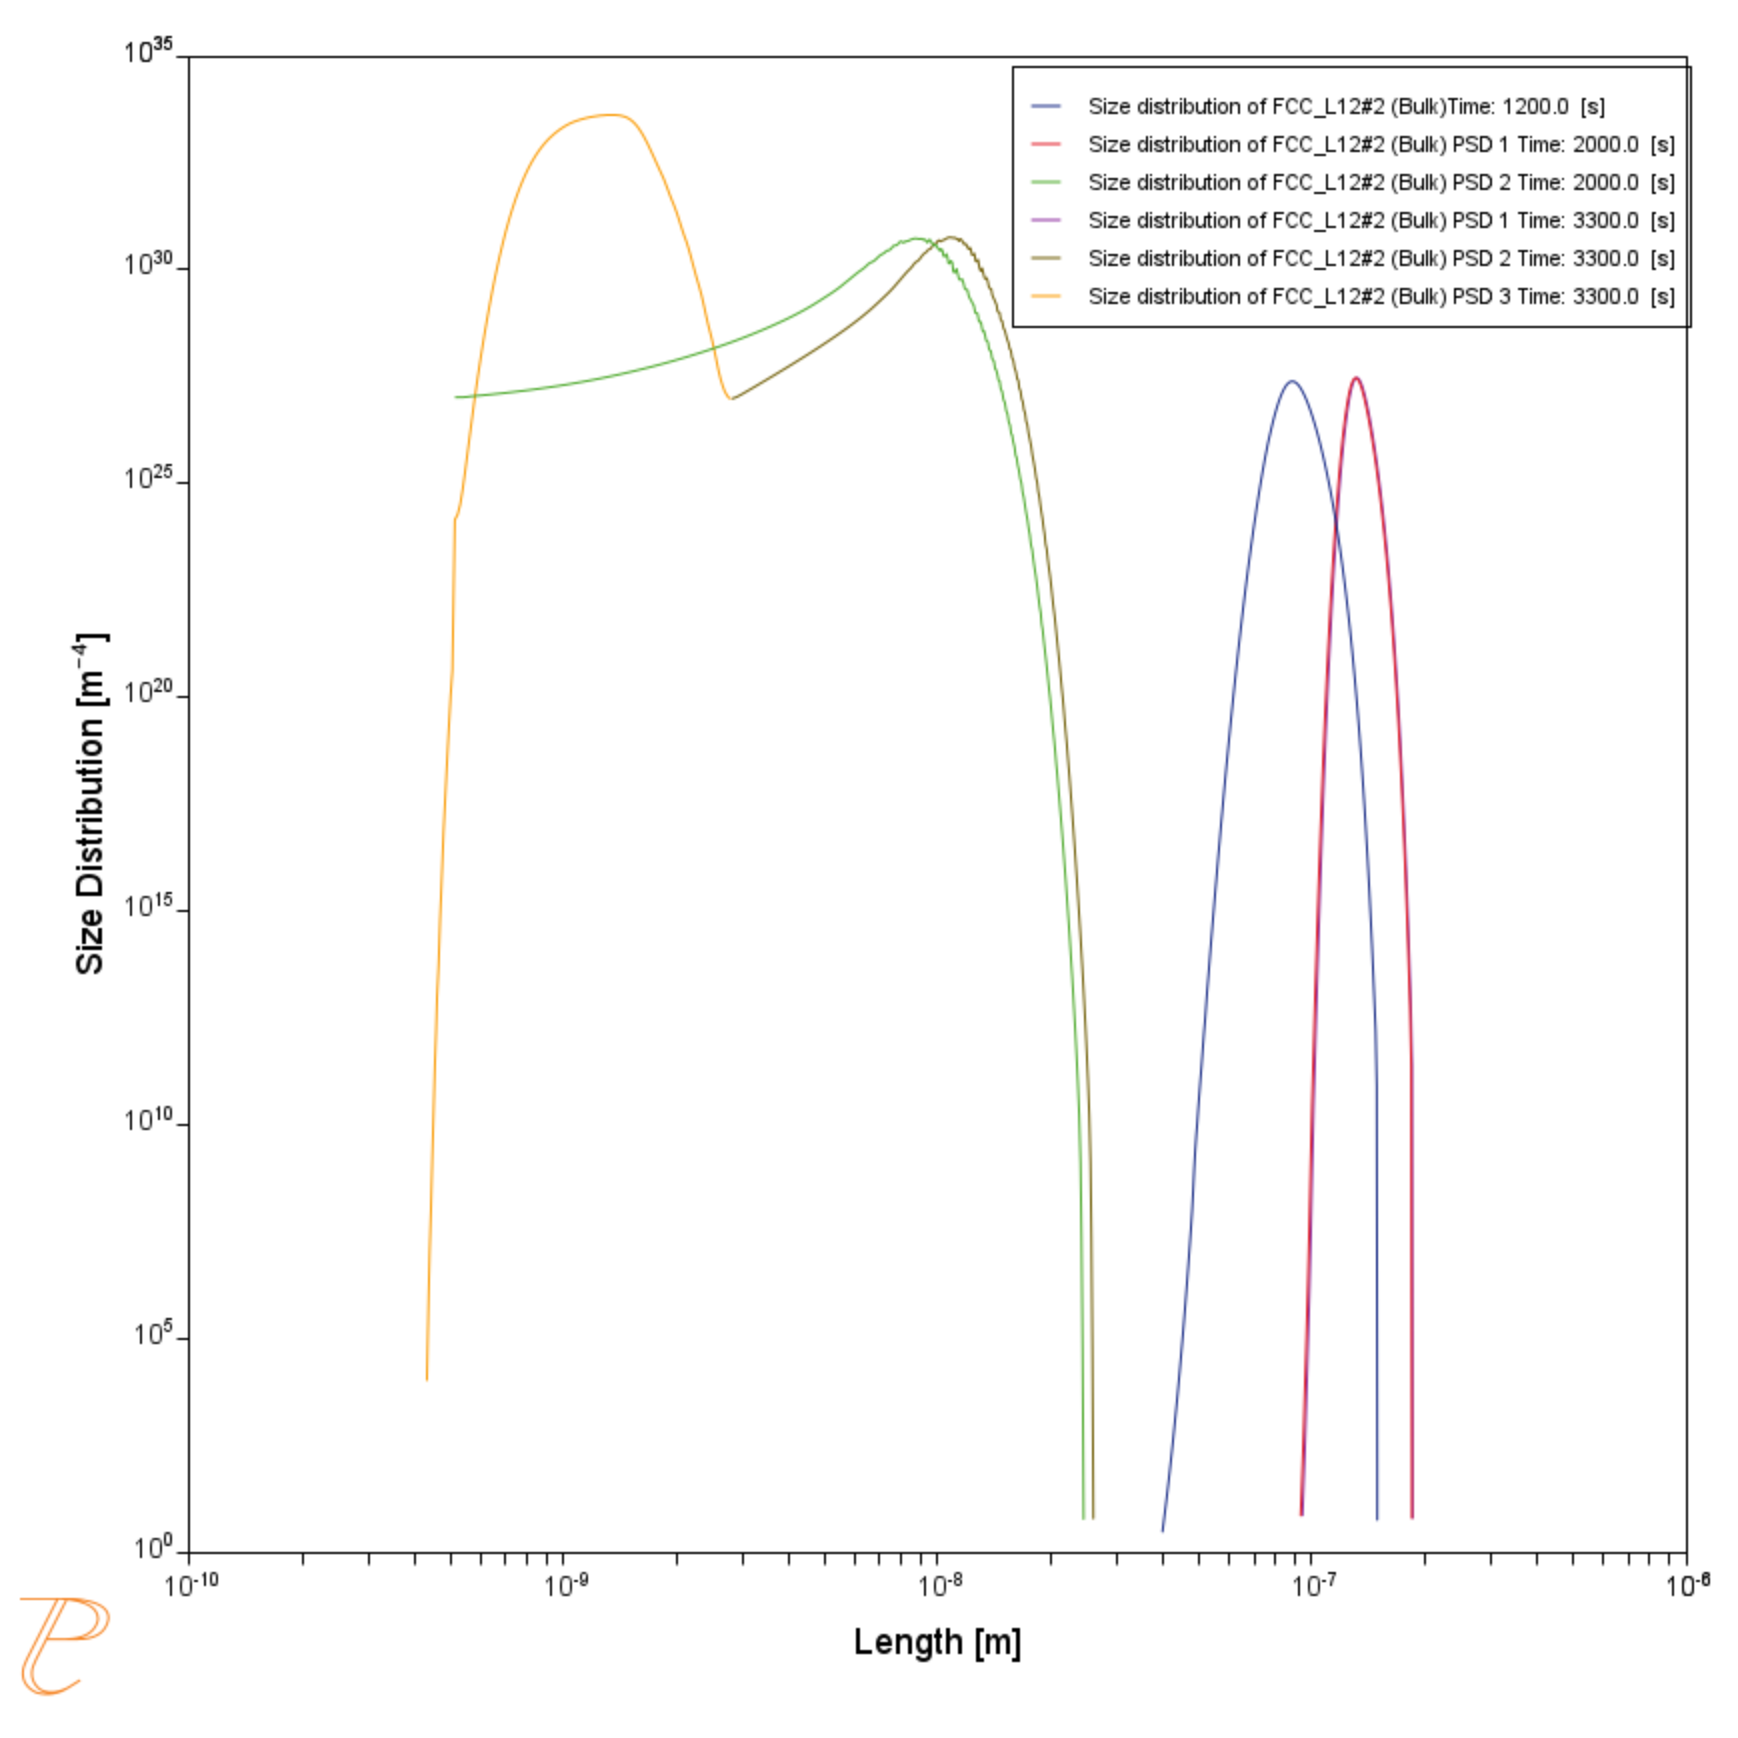
Figure 5: These results show the predicted size distributions of precipitates at different times during the quench for the Ni-10Al-10Cr alloy. The individual particle populations are distinguished using the “Separate multimodal PSD” option showing the formation of a tri-modal dispersion.
Reference
[2013Roj] T. Rojhirunsakool, S. Meher, J. Y. Hwang, S. Nag, J. Tiley, R. Banerjee, Influence of composition on monomodal versus multimodal γ′ precipitation in Ni–Al–Cr alloys. J. Mater. Sci. 48, 825–831 (2013).
![These results show the predicted evolution of the mean radius of gamma prime populations nucleating during the quench for the Ni-10Al-10Cr alloy. In this case three distinct particle populations are simulated to form, agreeing with [2013Roj]. These results show the predicted evolution of the mean radius of gamma prime populations nucleating during the quench for the Ni-10Al-10Cr alloy. In this case three distinct particle populations are simulated to form, agreeing with [2013Roj].](../../resources/images/tc-prisma/examples/p-06-meanrad-10alcr.png)
