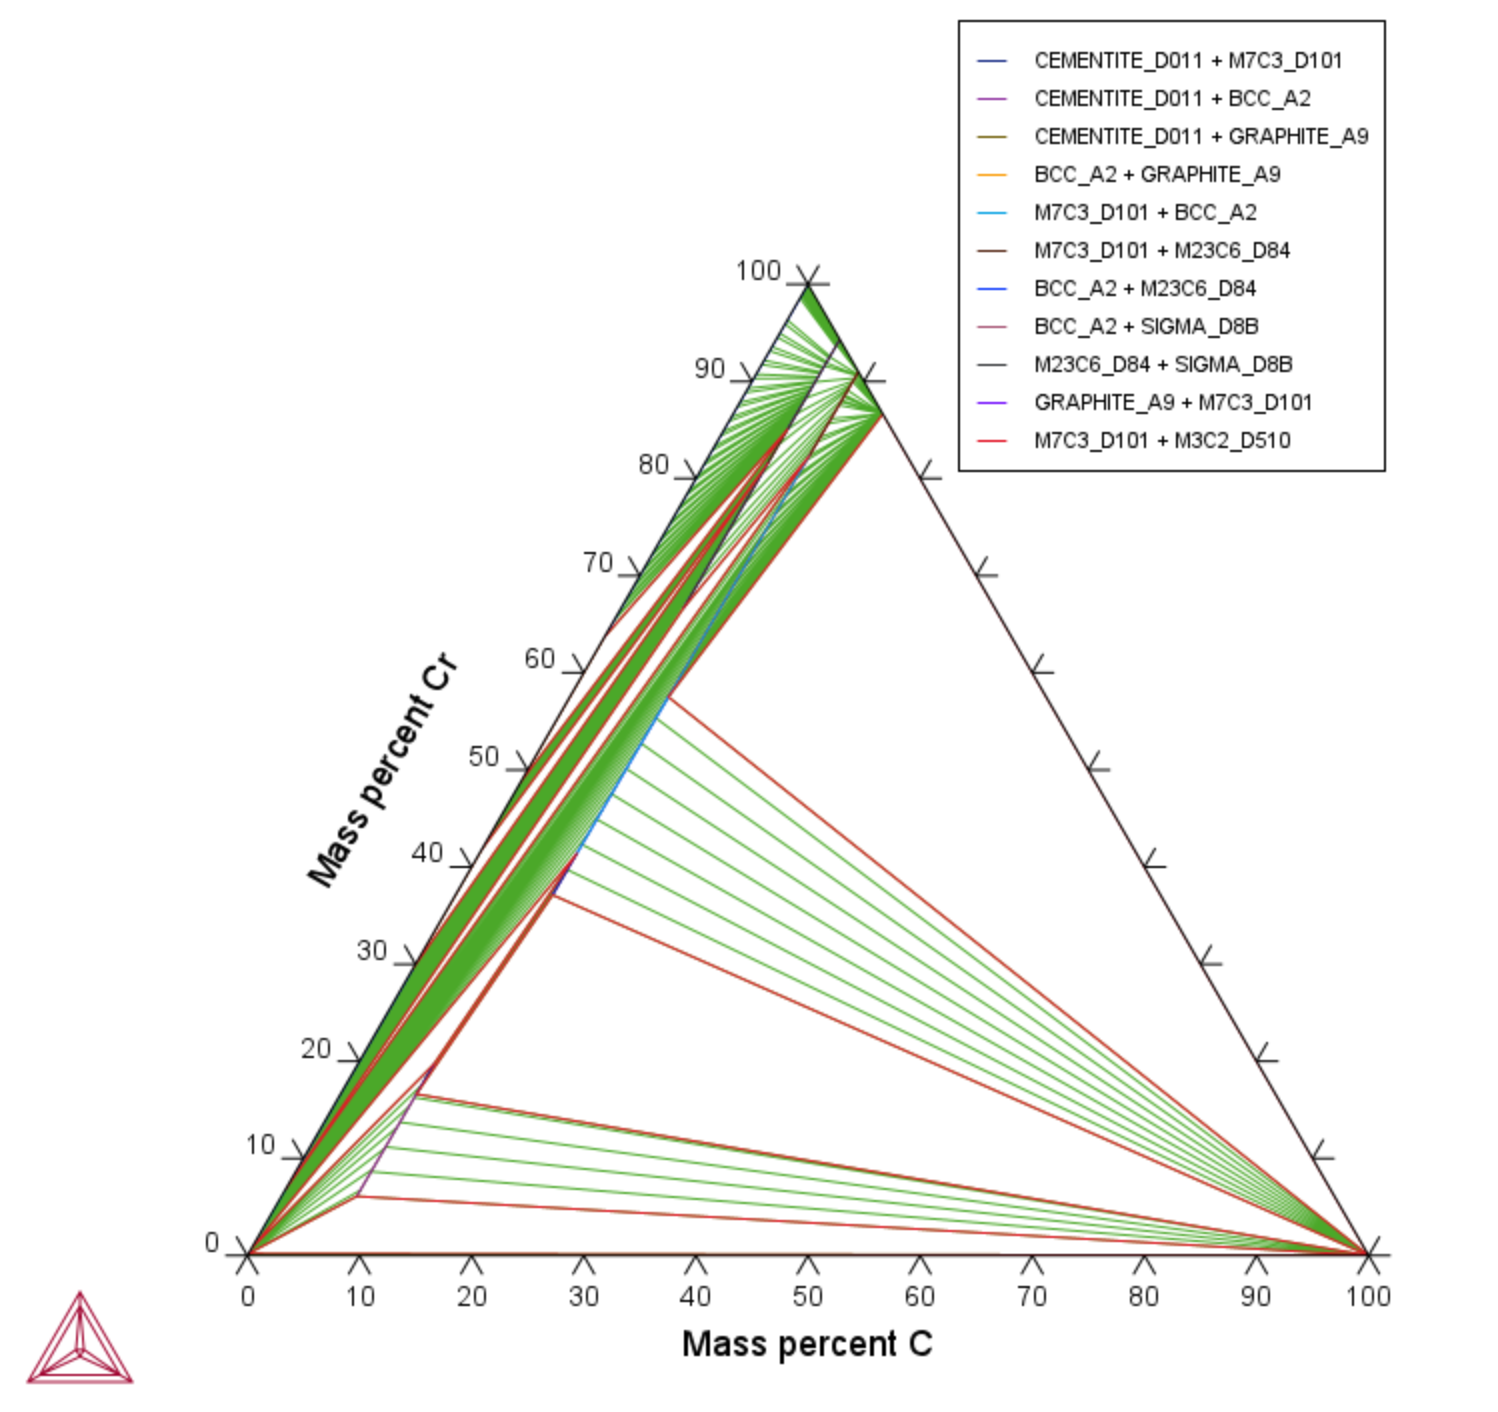
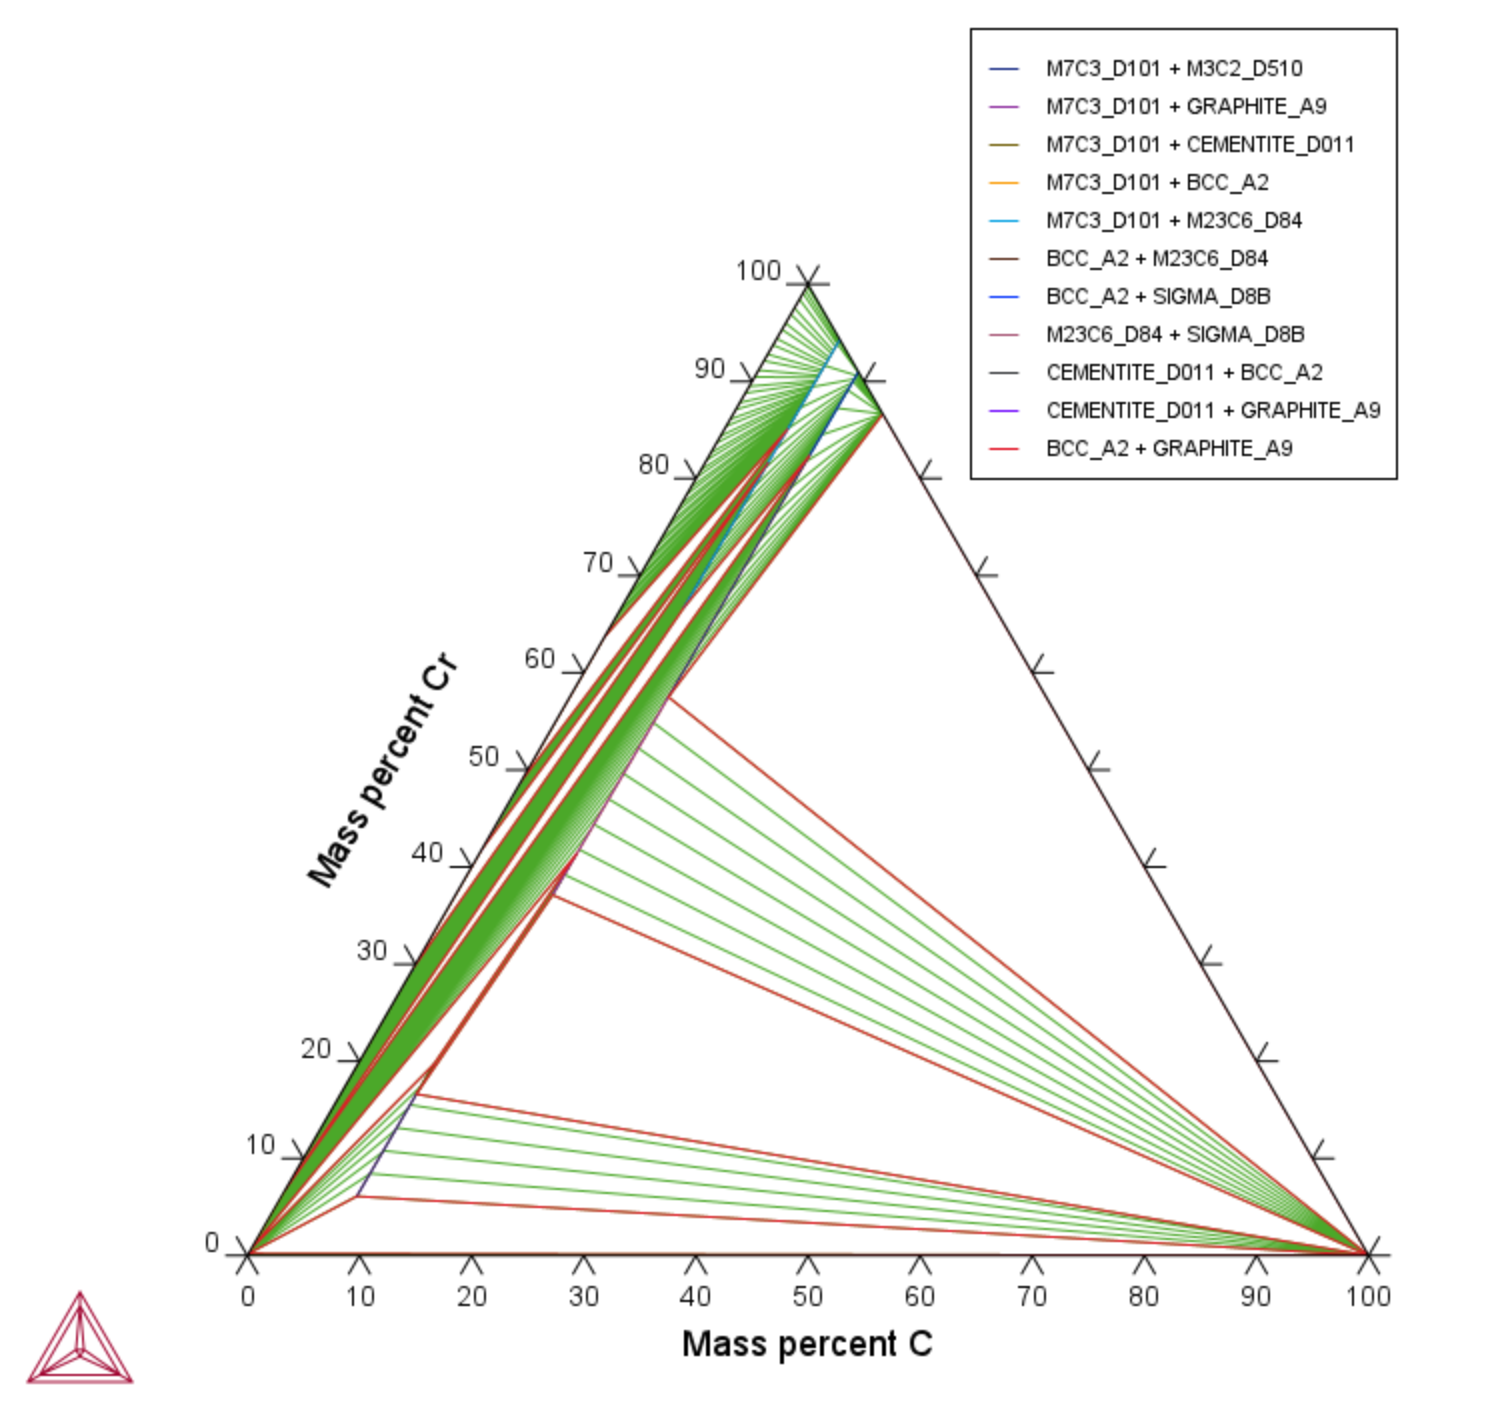
T_04: Fe-Cr-C Ternary Phase Diagram at 1000 K
This example shows a ternary phase diagram in the Fe-Cr-C system at 1000 K. Similar to example T_03: Fe-C Phase Diagrams, the same diagram is calculated using a
- Folder: Thermo‑Calc
- File name: T_04_Fe-Cr-C_ternary_phase_diagram.tcu
Visualizations
This example is included as a tutorial on our website and as part of the Graphical Mode Examples playlist on our YouTube channel.
Open the example project file to review the node setup on the Project window and the associated settings on the Configuration window for each node. For some types of projects, you can also adjust settings on the Plot Renderer Configuration window to preview results before performing the simulation. Click Perform Tree to generate plots and tables to see the results on the Visualizations window.
In the Plot Renderer settings window, click Show more and Show less to toggle between viewing all or some of the available settings.
Try practicing with two features on the Plot Renderer Configuration window.


