T_16: Electrical Resistivity and Thermal Conductivity for Pure Copper
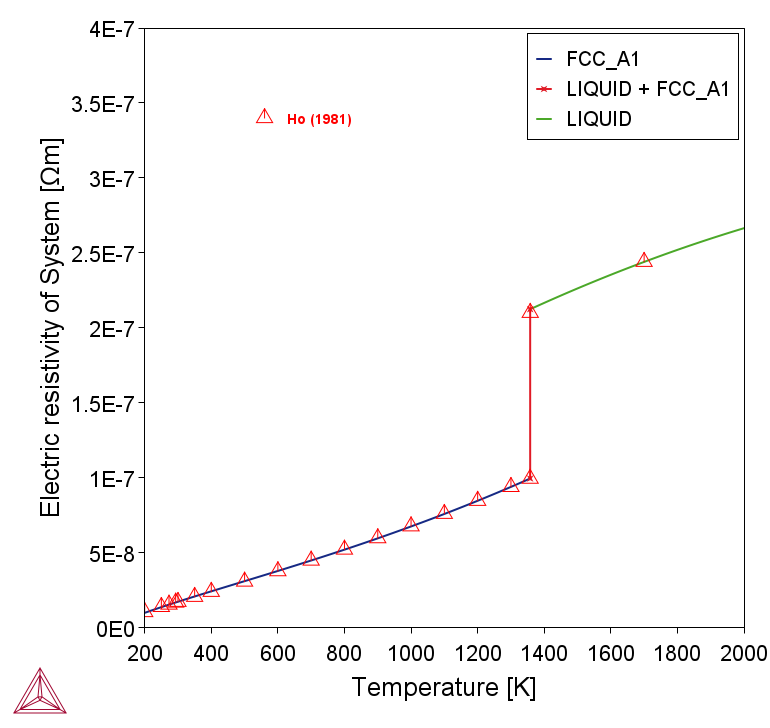
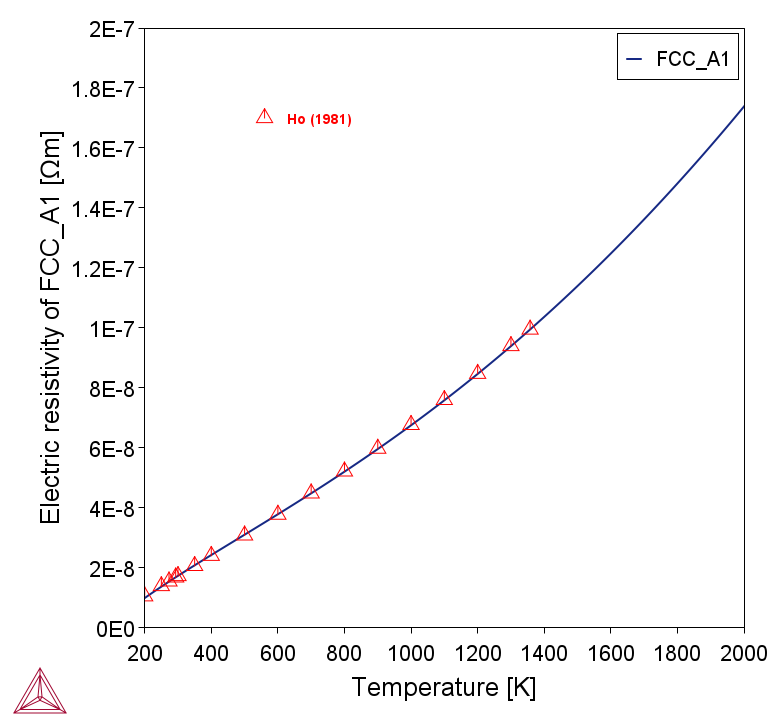
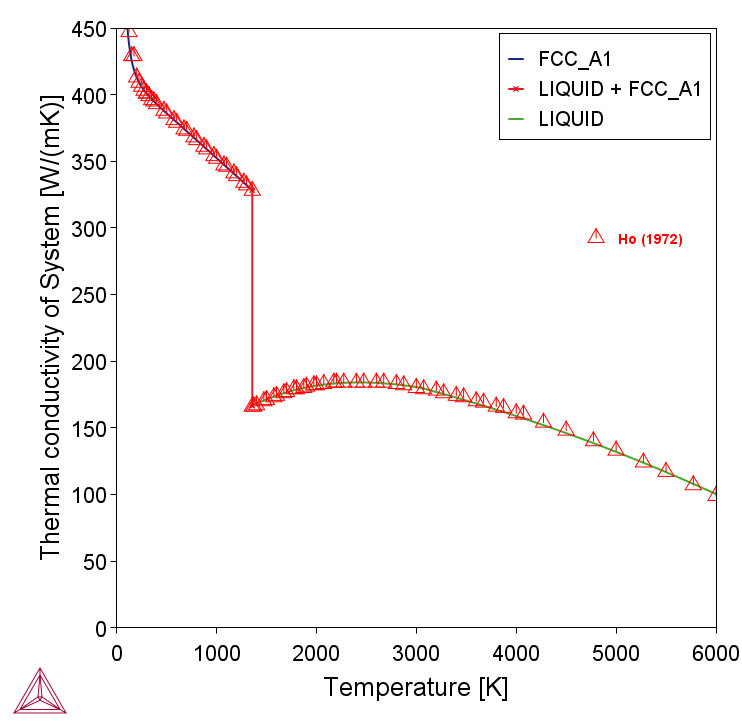
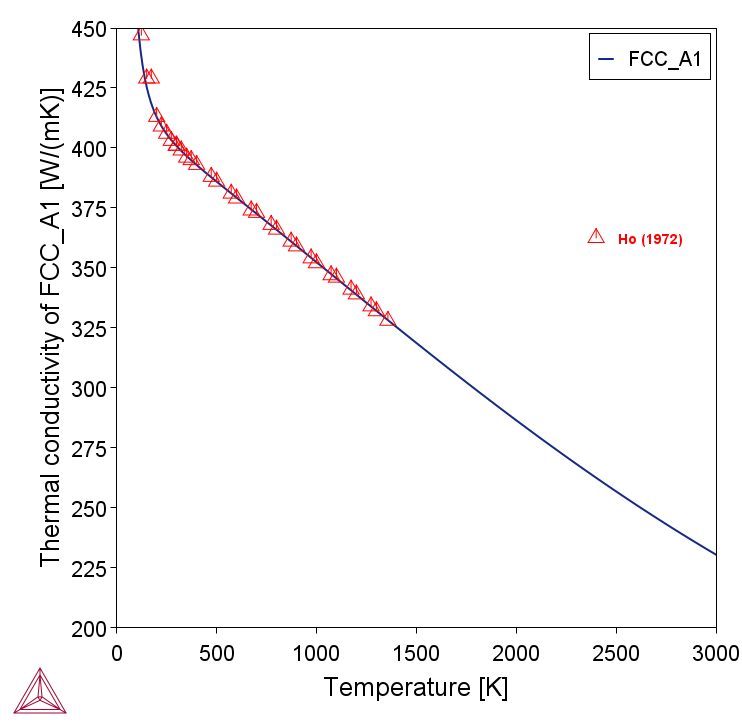
This example calculates the electrical resistivity (ELRS) and thermal conductivity (THCD) of pure Cu. It makes a One Axis (step) calculation over a wide temperature range, covering both the FCC_A1 state and the liquid state. It plots thermal conductivity of the system (both FCC_A1 and liquid) and that of a single phase (taking FCC_A1 as an example), respectively. Also it plots electrical resistivity of the system and that of FCC_A1.
The example set up uses an Equilibrium Calculator combined with four Experimental File Reader nodes that take data from the included 1972Ho_cu_thcd.exp and 1981Ho_cu_elrs.exp files.
The example is available to all users as it uses the ALDEMO database, which is the free demonstration version of the TCS Al-based Alloy Database (TCAL).
- Folder: Thermo‑Calc
- File name: T_16_Electrical_Resistivity_Thermal_Conductivity_Cu.tcu
- Experimental data files included
1972Ho_cu_thcd.expand1981Ho_cu_elrs.exp
The same example is also provided in Console Mode as tcex60.
Visualizations
This example is included as a tutorial on our website and as part of the Graphical Mode Examples playlist on our YouTube channel.
Open the example project file to review the node setup on the Project window and the associated settings on the Configuration window for each node. For some types of projects, you can also adjust settings on the Plot Renderer Configuration window to preview results before performing the simulation. Click Perform Tree to generate plots and tables to see the results on the Visualizations window.
Figure 1: The electrical resistivity (ELRS) of pure Cu over a wide temperature range, covering both the FCC_A1 state and the liquid state. The data was recommended by [1981Ho].
Figure 2: The electrical resistivity (ELRS) of a single phase (FCC_A1) vs. temperature. The data was recommended by [1981Ho].
Figure 3: The thermal conductivity of pure Cu over a wide temperature range, covering both the FCC_A1 state and the liquid state. The data was recommended by [1972Ho].
Figure 4: The thermal conductivity (THCD) of a single phase (FCC_A1) vs. temperature. The data was recommended by [1972Ho].
References
[1972Ho] C. Y. Ho, R. W. Powell, P. E. Liley, Thermal Conductivity of the Elements. J. Phys. Chem. Ref. Data. 1, 279–421 (1972).
[1981Ho] C. Y. Ho, M. W. Ackerman, K. Y. Wu, T. N. Havill, R. H. Bogaard, R. A. Matula, S. G. Oh, and H. M. James. Electrical resistivity of ten selected binary alloy systems. CINDAS report 59, for Office of standard reference data National Bureau of Standards, Department of Commerce (1981).
More Information
For more advanced examples using the TCAL database, see PM_G_10: Freeze-in Thermal Conductivity and PM_G_11: Freeze-in Electrical Resistivity.
The thermophysical properties are progressively being added to the Thermo‑Calc databases starting with Thermo‑Calc software version 2020a.
You can learn more about the models by searching the help (press F1 when in Thermo‑Calc).
You can find information on our website about the properties that can be calculated with Thermo‑Calc and the Add‑on Modules.


