Stereology
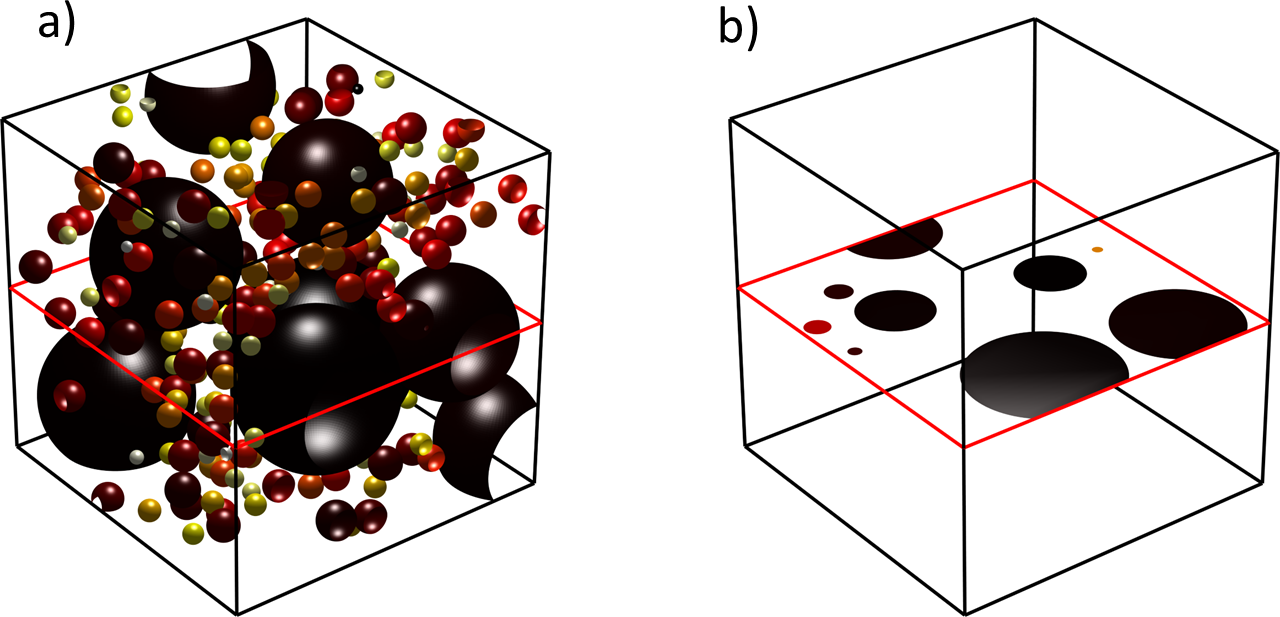
Stereology is the science of assessing the three-dimensional (3D) geometry and morphology of objects utilizing data descriptive of a cross-section of the material. It is common to characterize a precipitate dispersion utilizing quantitative image analysis of micrographs obtained from light or scanning electron microscopy. In these cases, the data describes the precipitates found in a cross-section taken through the sample.
Figure 1: a) A 3D dispersion of non-penetrating polydisperse particles. b) A cross-section taken through the dispersion.
Stereological considerations are important when seeking greater quantitative accuracy comparing model calculations and experimental data. The two-dimensional (2D) size distribution is of interest for the calculation of mechanical properties as it represents the size distribution of obstacles encountered by a dislocation on a slip system.
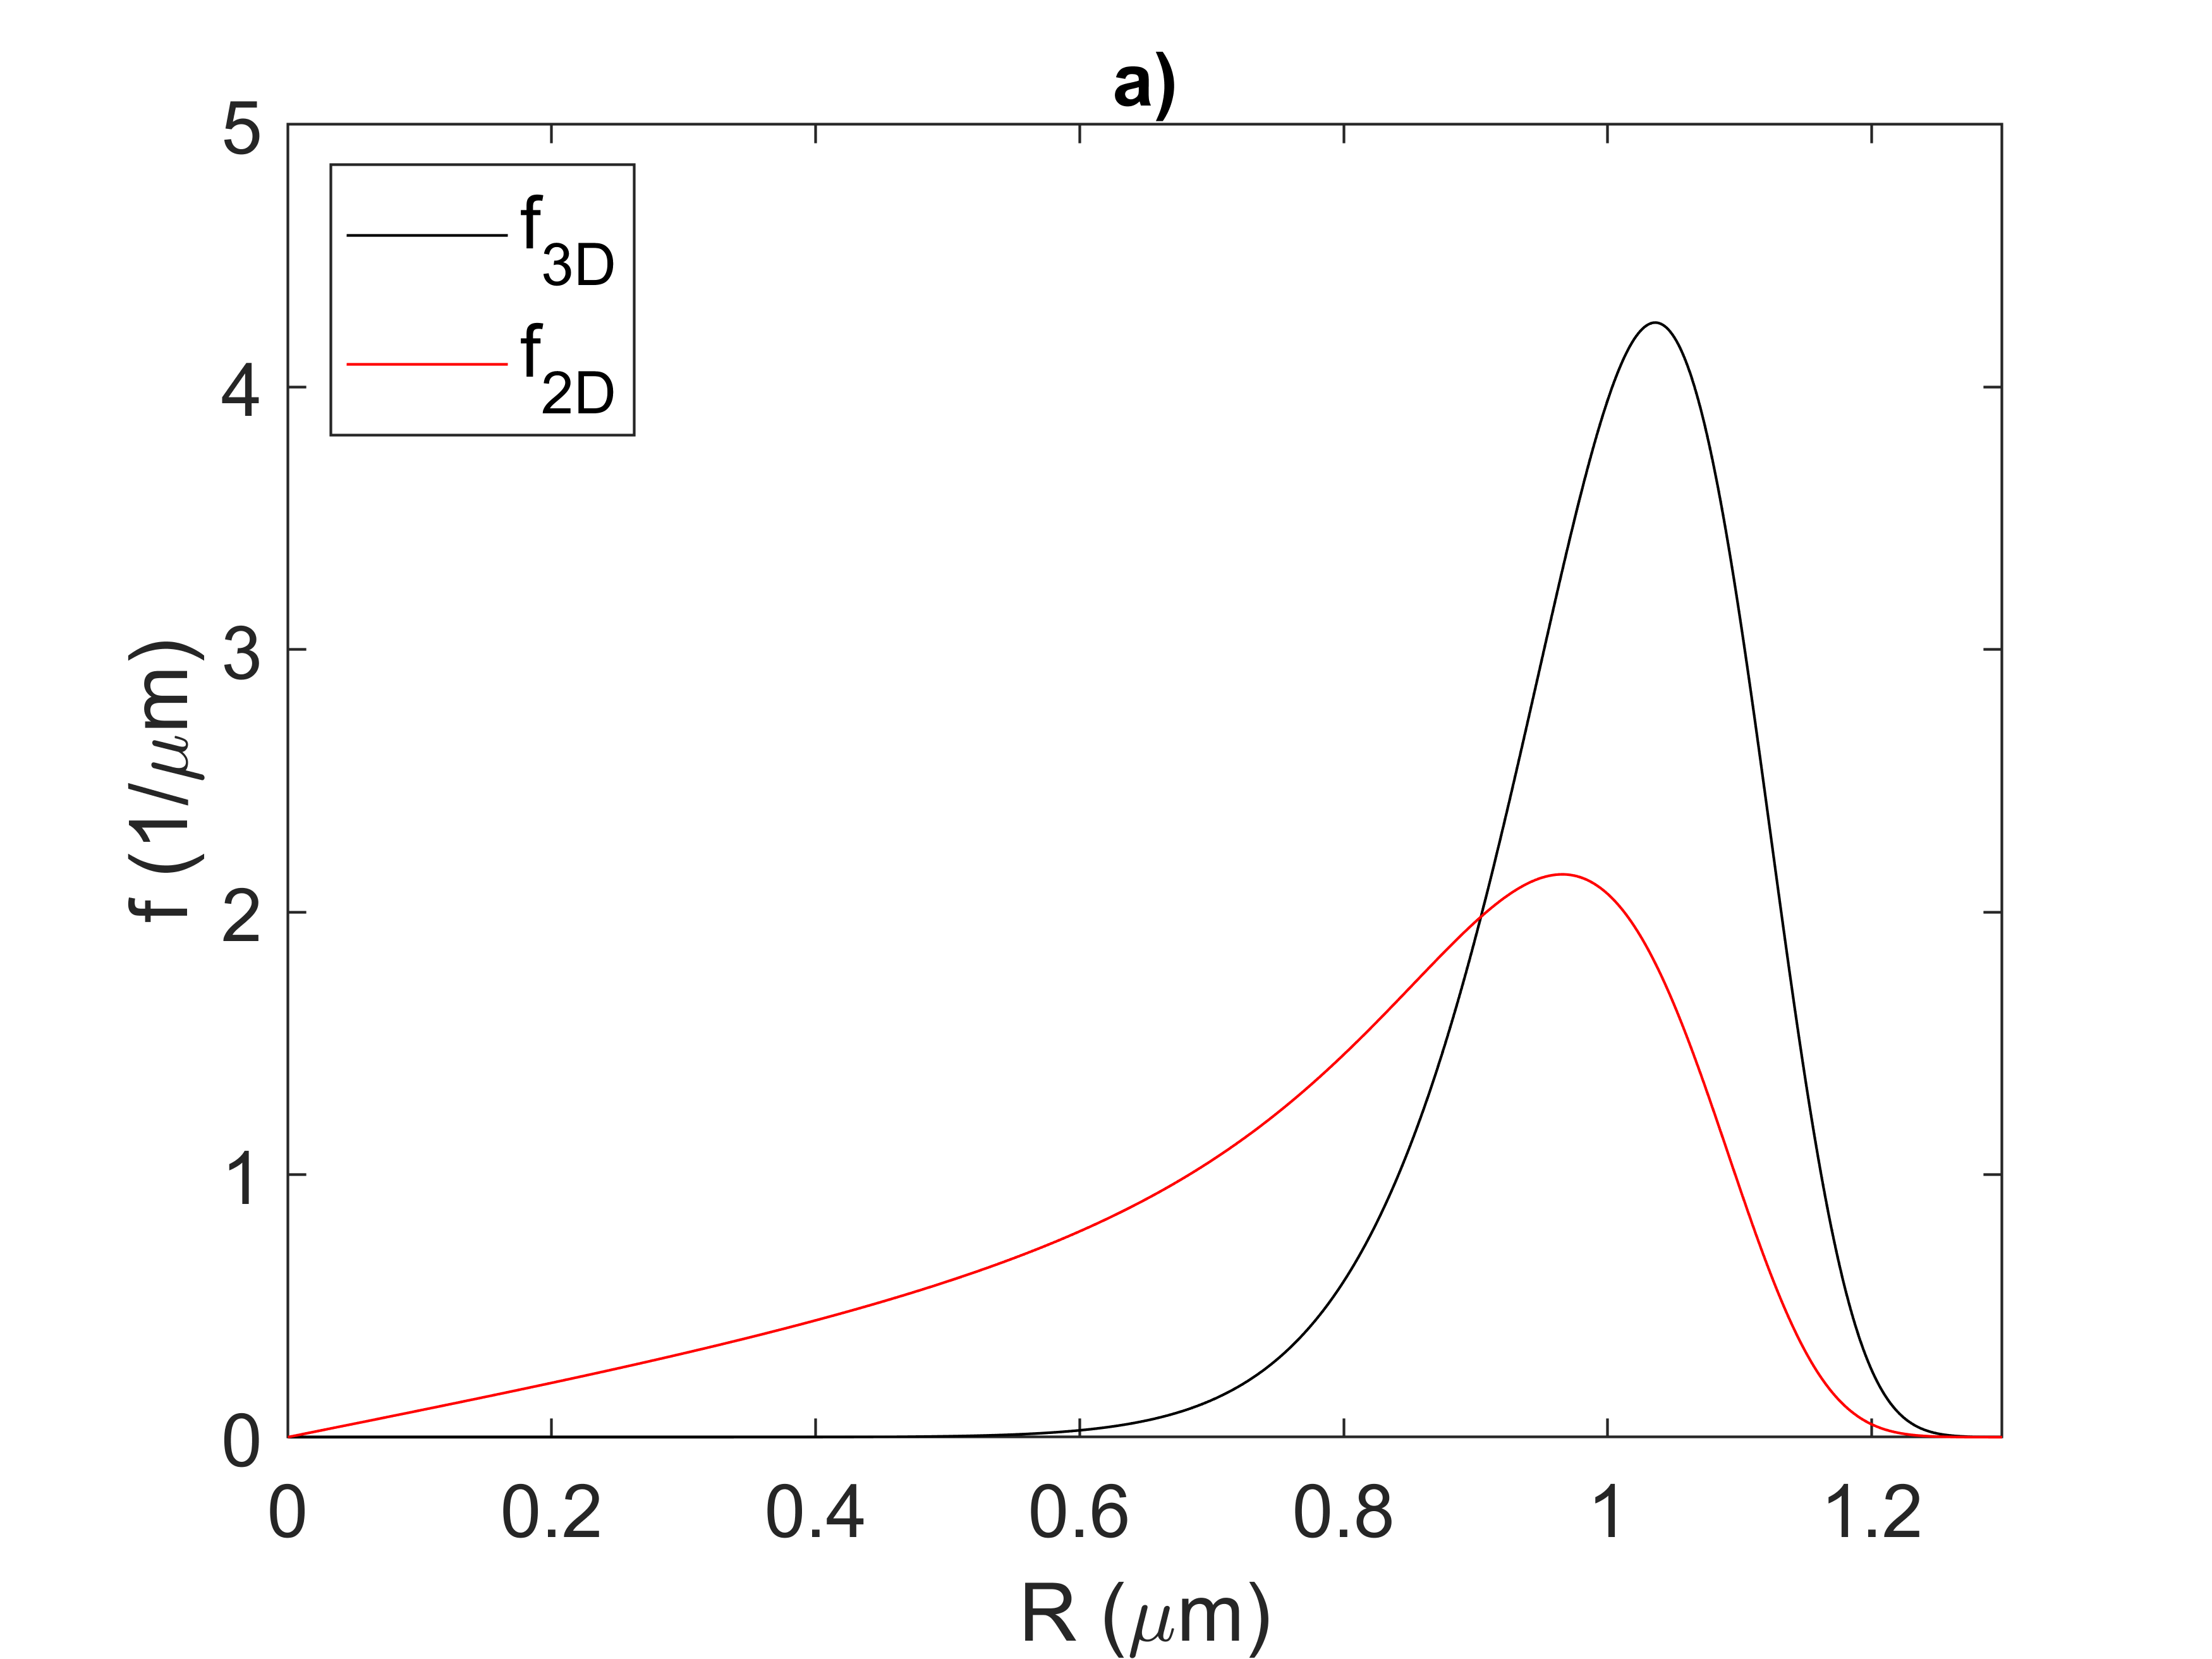
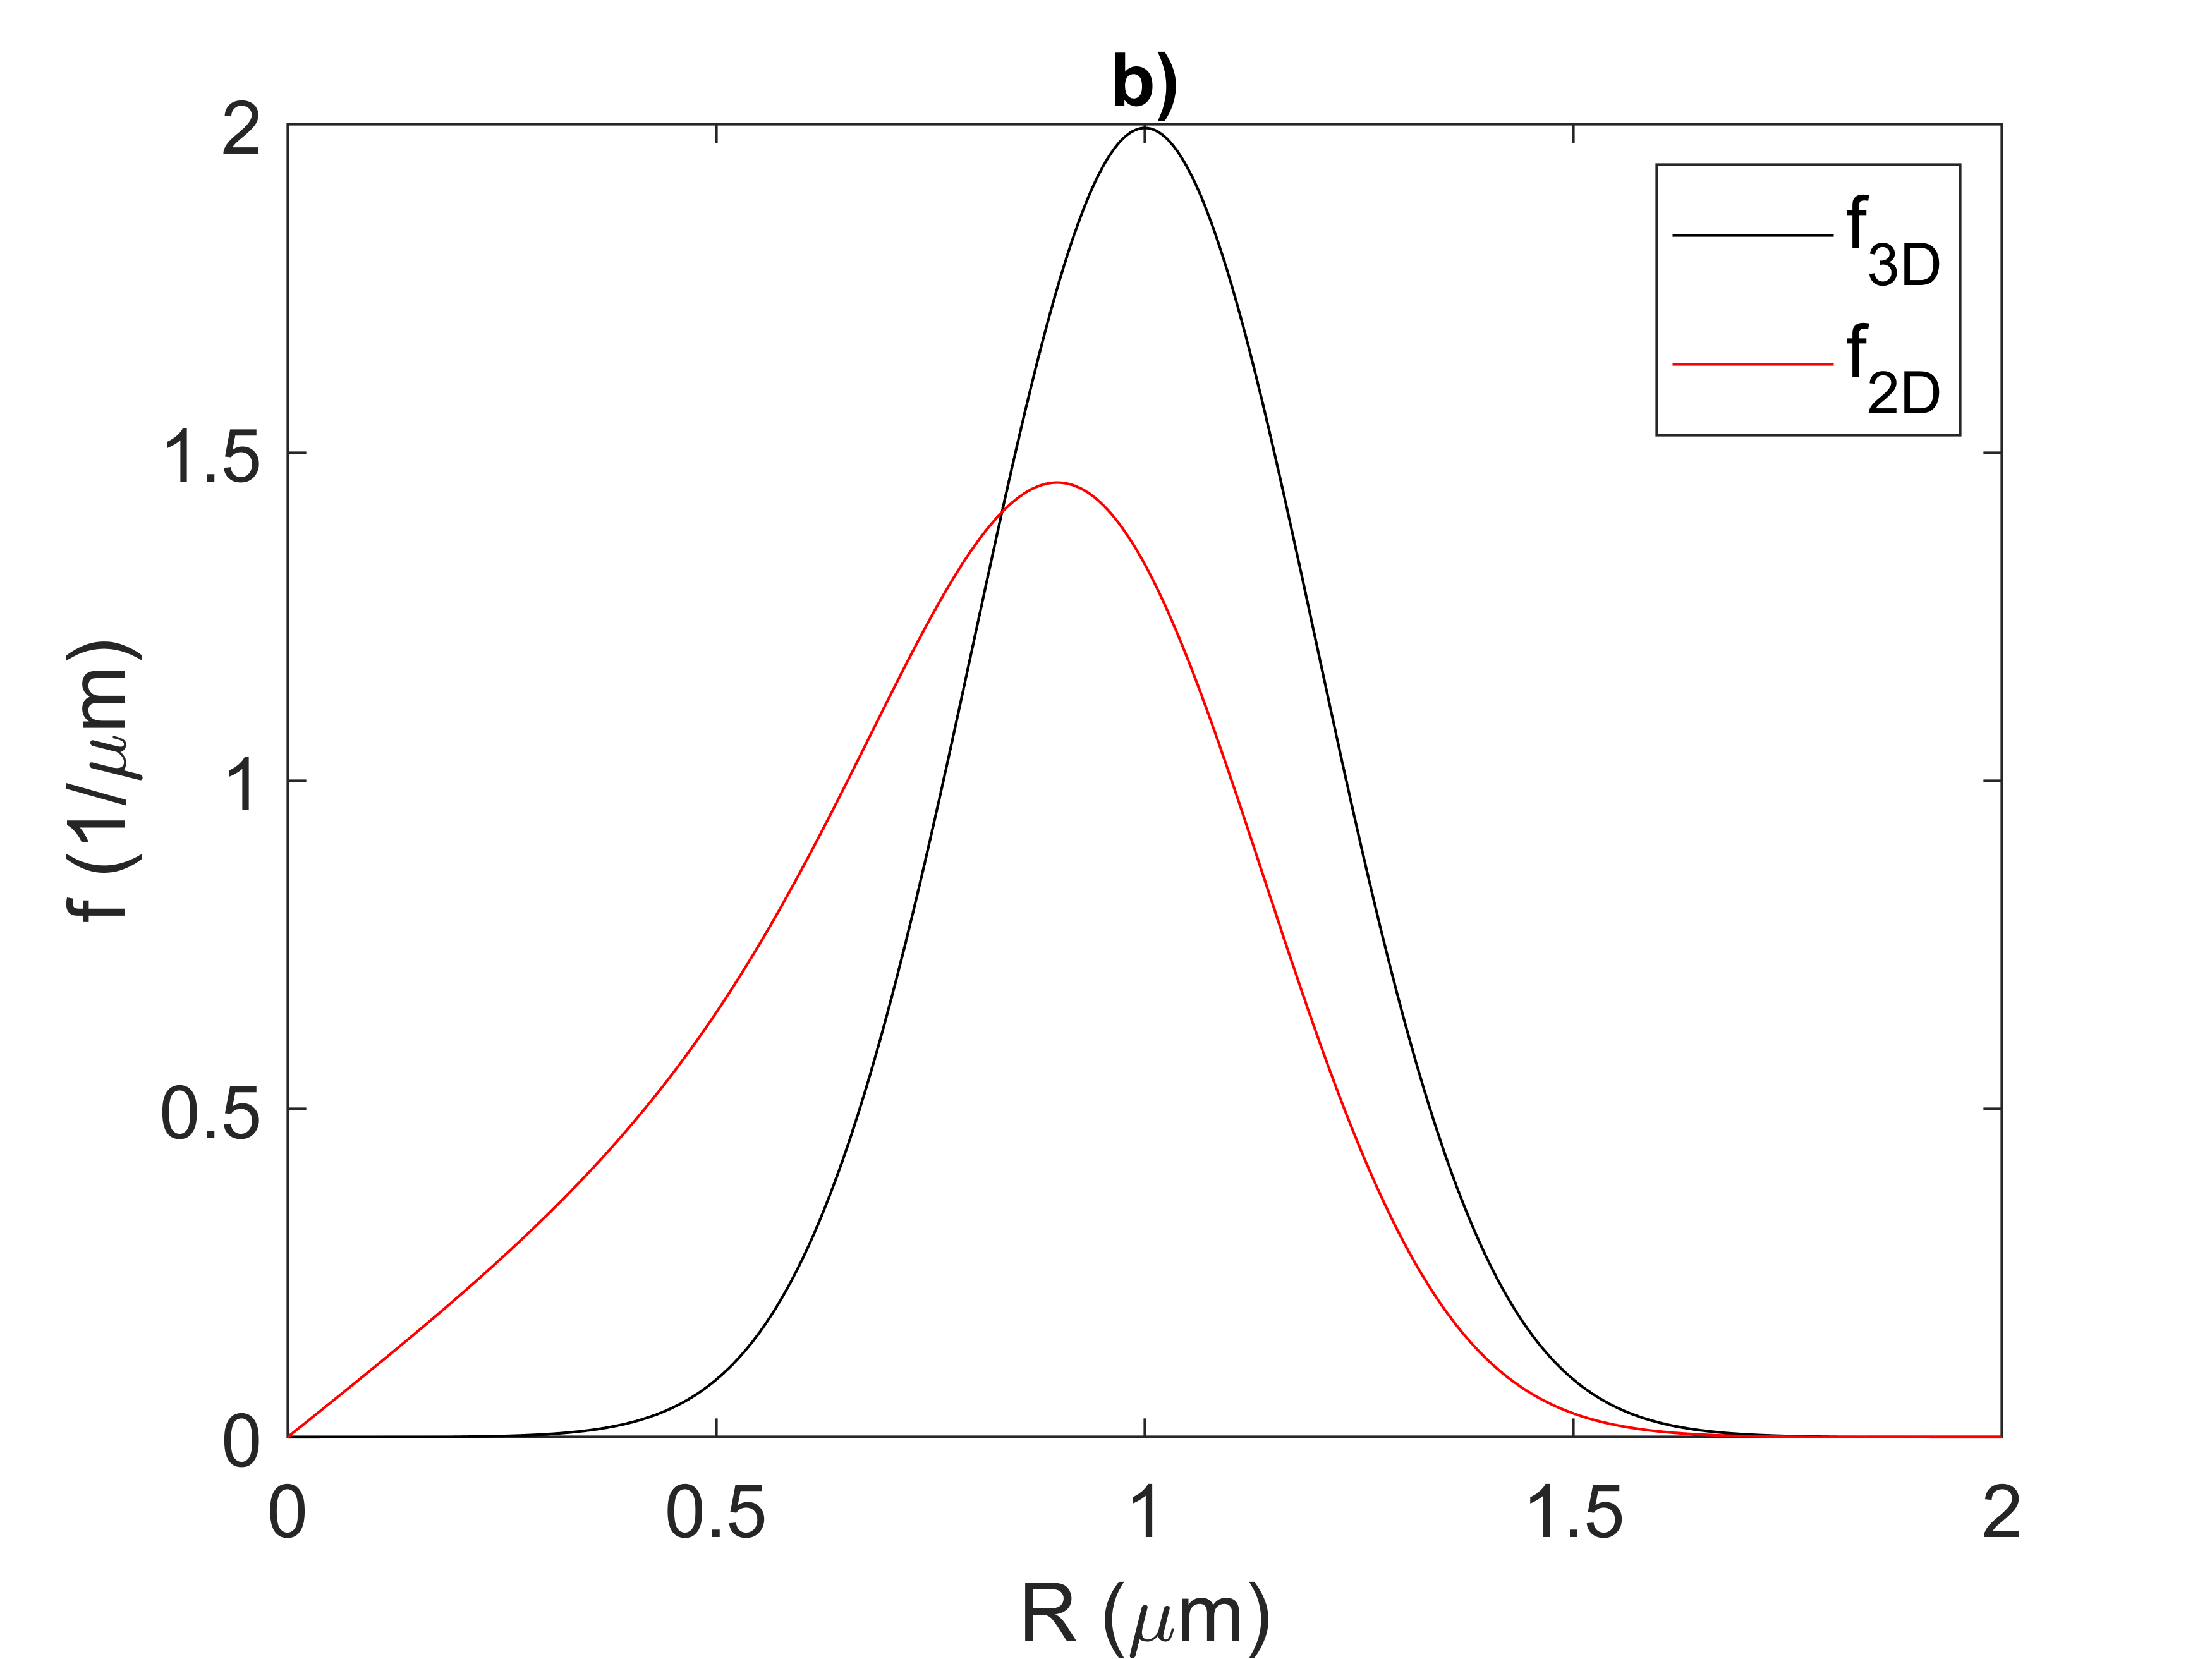
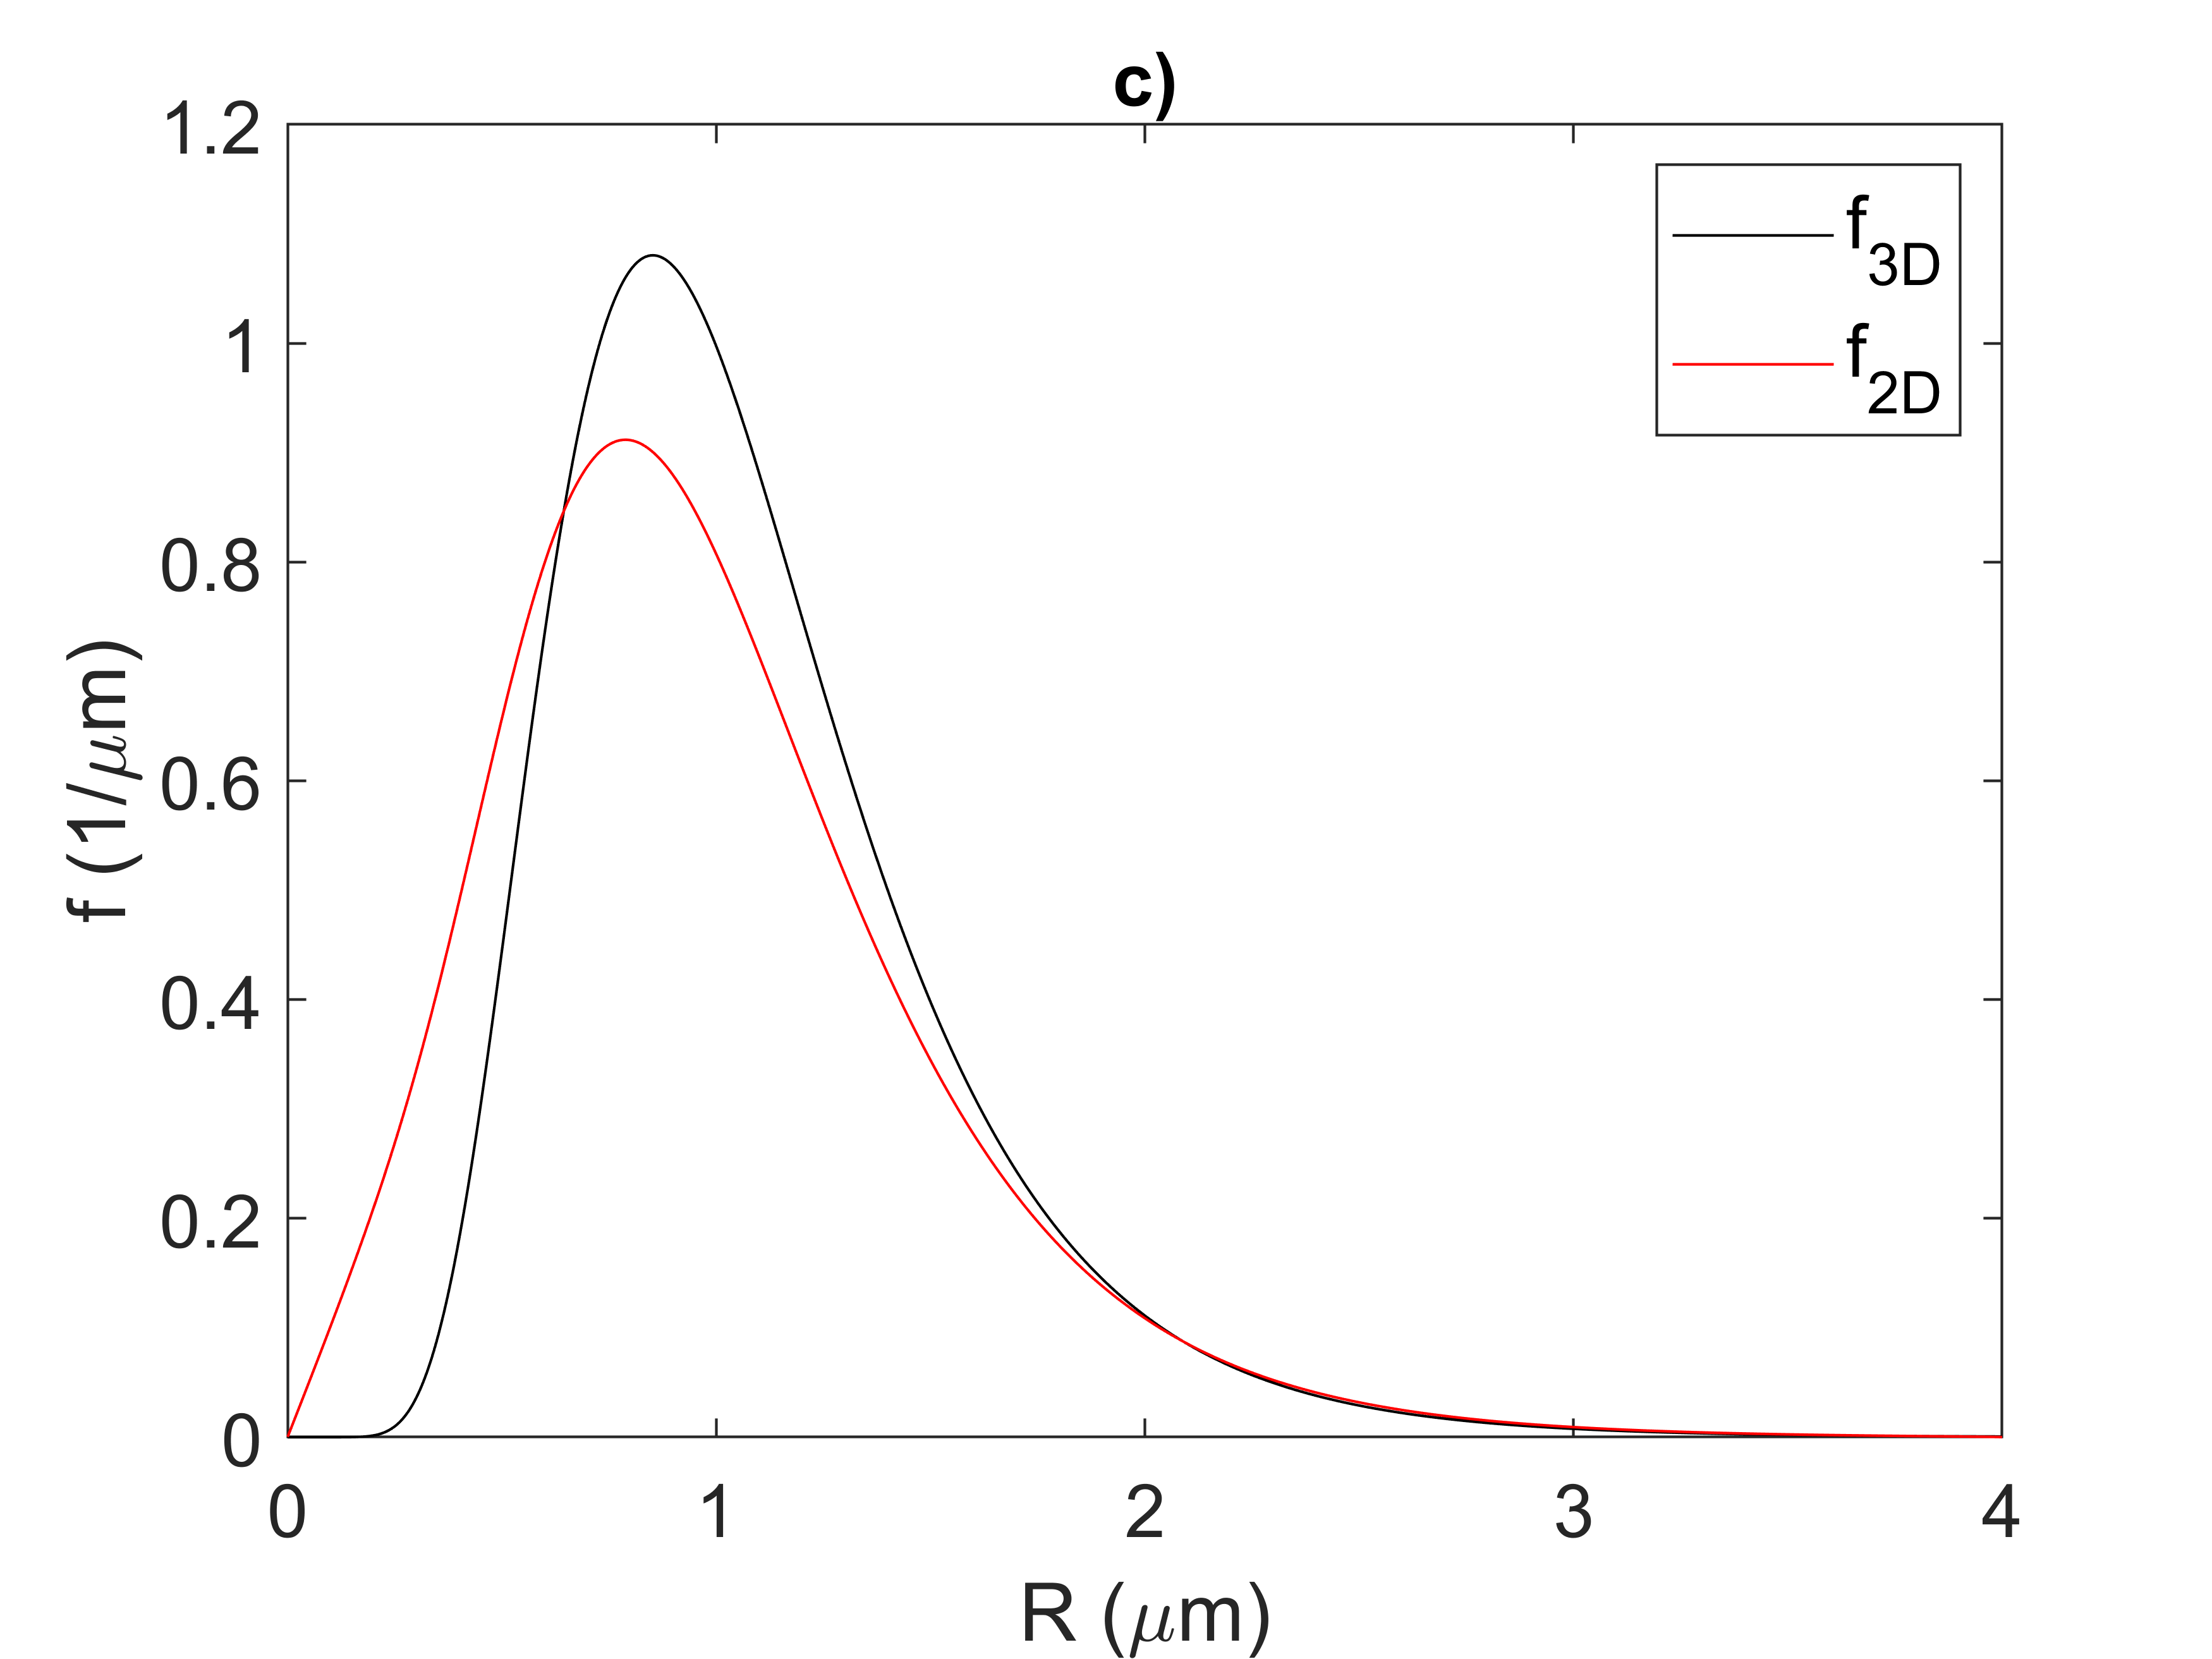
The size of the precipitates can be expressed as the equivalent radius of a circle with the same cross-sectional area as measured from the micrograph. Figure 2, Figure 3, and Figure 4 compare the 3D and 2D size distributions of a spherical dispersion considering a left skewed, a normal, and a right-skewed distribution. Observe the changes in shape of the distribution in addition to the smaller 2D mean radius compared to the true 3D size.
The 3D to 2D conversion implementation considers spherical particles. Although the precipitates may be approximated as spherical for the approximation of the 2D size distribution, there may be a large error for geometries that differ largely from spheres.
The 3D → 2D checkbox that is available to use this feature requires (1) that the Precipitate Phase Morphology is set to Sphere on the Precipitation Calculator, and then (2) one of these axis variables is selected on either the Plot or Table Renderer: Mean radius, Size distribution, Number density distribution, or Normalized number density distribution.
Figure 2: A comparison of the 3D and 2D particle size distributions considering a left-hand skewed Weibull distribution.
Figure 3: A comparison of the 3D and 2D particle size distributions considering a normal distribution
Figure 4: A comparison of the 3D and 2D particle size distributions considering a right-hand skewed log-normal distribution.
Analytical solutions exist for the determination of the 2D size distribution of impenetrable polydisperse spheres [1958Sal; 1925Wic]. Thermo-Calc has implemented the Jeppsson-Mannesson-Borgenstam-Agren (JMBA) [2011Jep] Saltykov conversion method to calculate the 2D size distribution.
Let  describe the number of particles with radius varying between
  and
and  within a unit volume. The corresponding 2D size distribution is given by
  , describing the number of particle cross-sections with a radius varying between
  and
and  within a unit area. Following the Saltykov method, the 2D size distribution is obtained from the following matrix calculation:

where  is a matrix of probabilities for the conversion and
  describe the likelihood of obtaining a 2D cross-section of radius
  from 3D grains of radius
  . The JMBA model derived these probabilities as:

Where  and
and  describe the lower and upper boundaries to the particle radii class
  .
.  and
and  are the spacing between radii midpoints and class boundaries, respectively. For a linear discretization,
  .
.
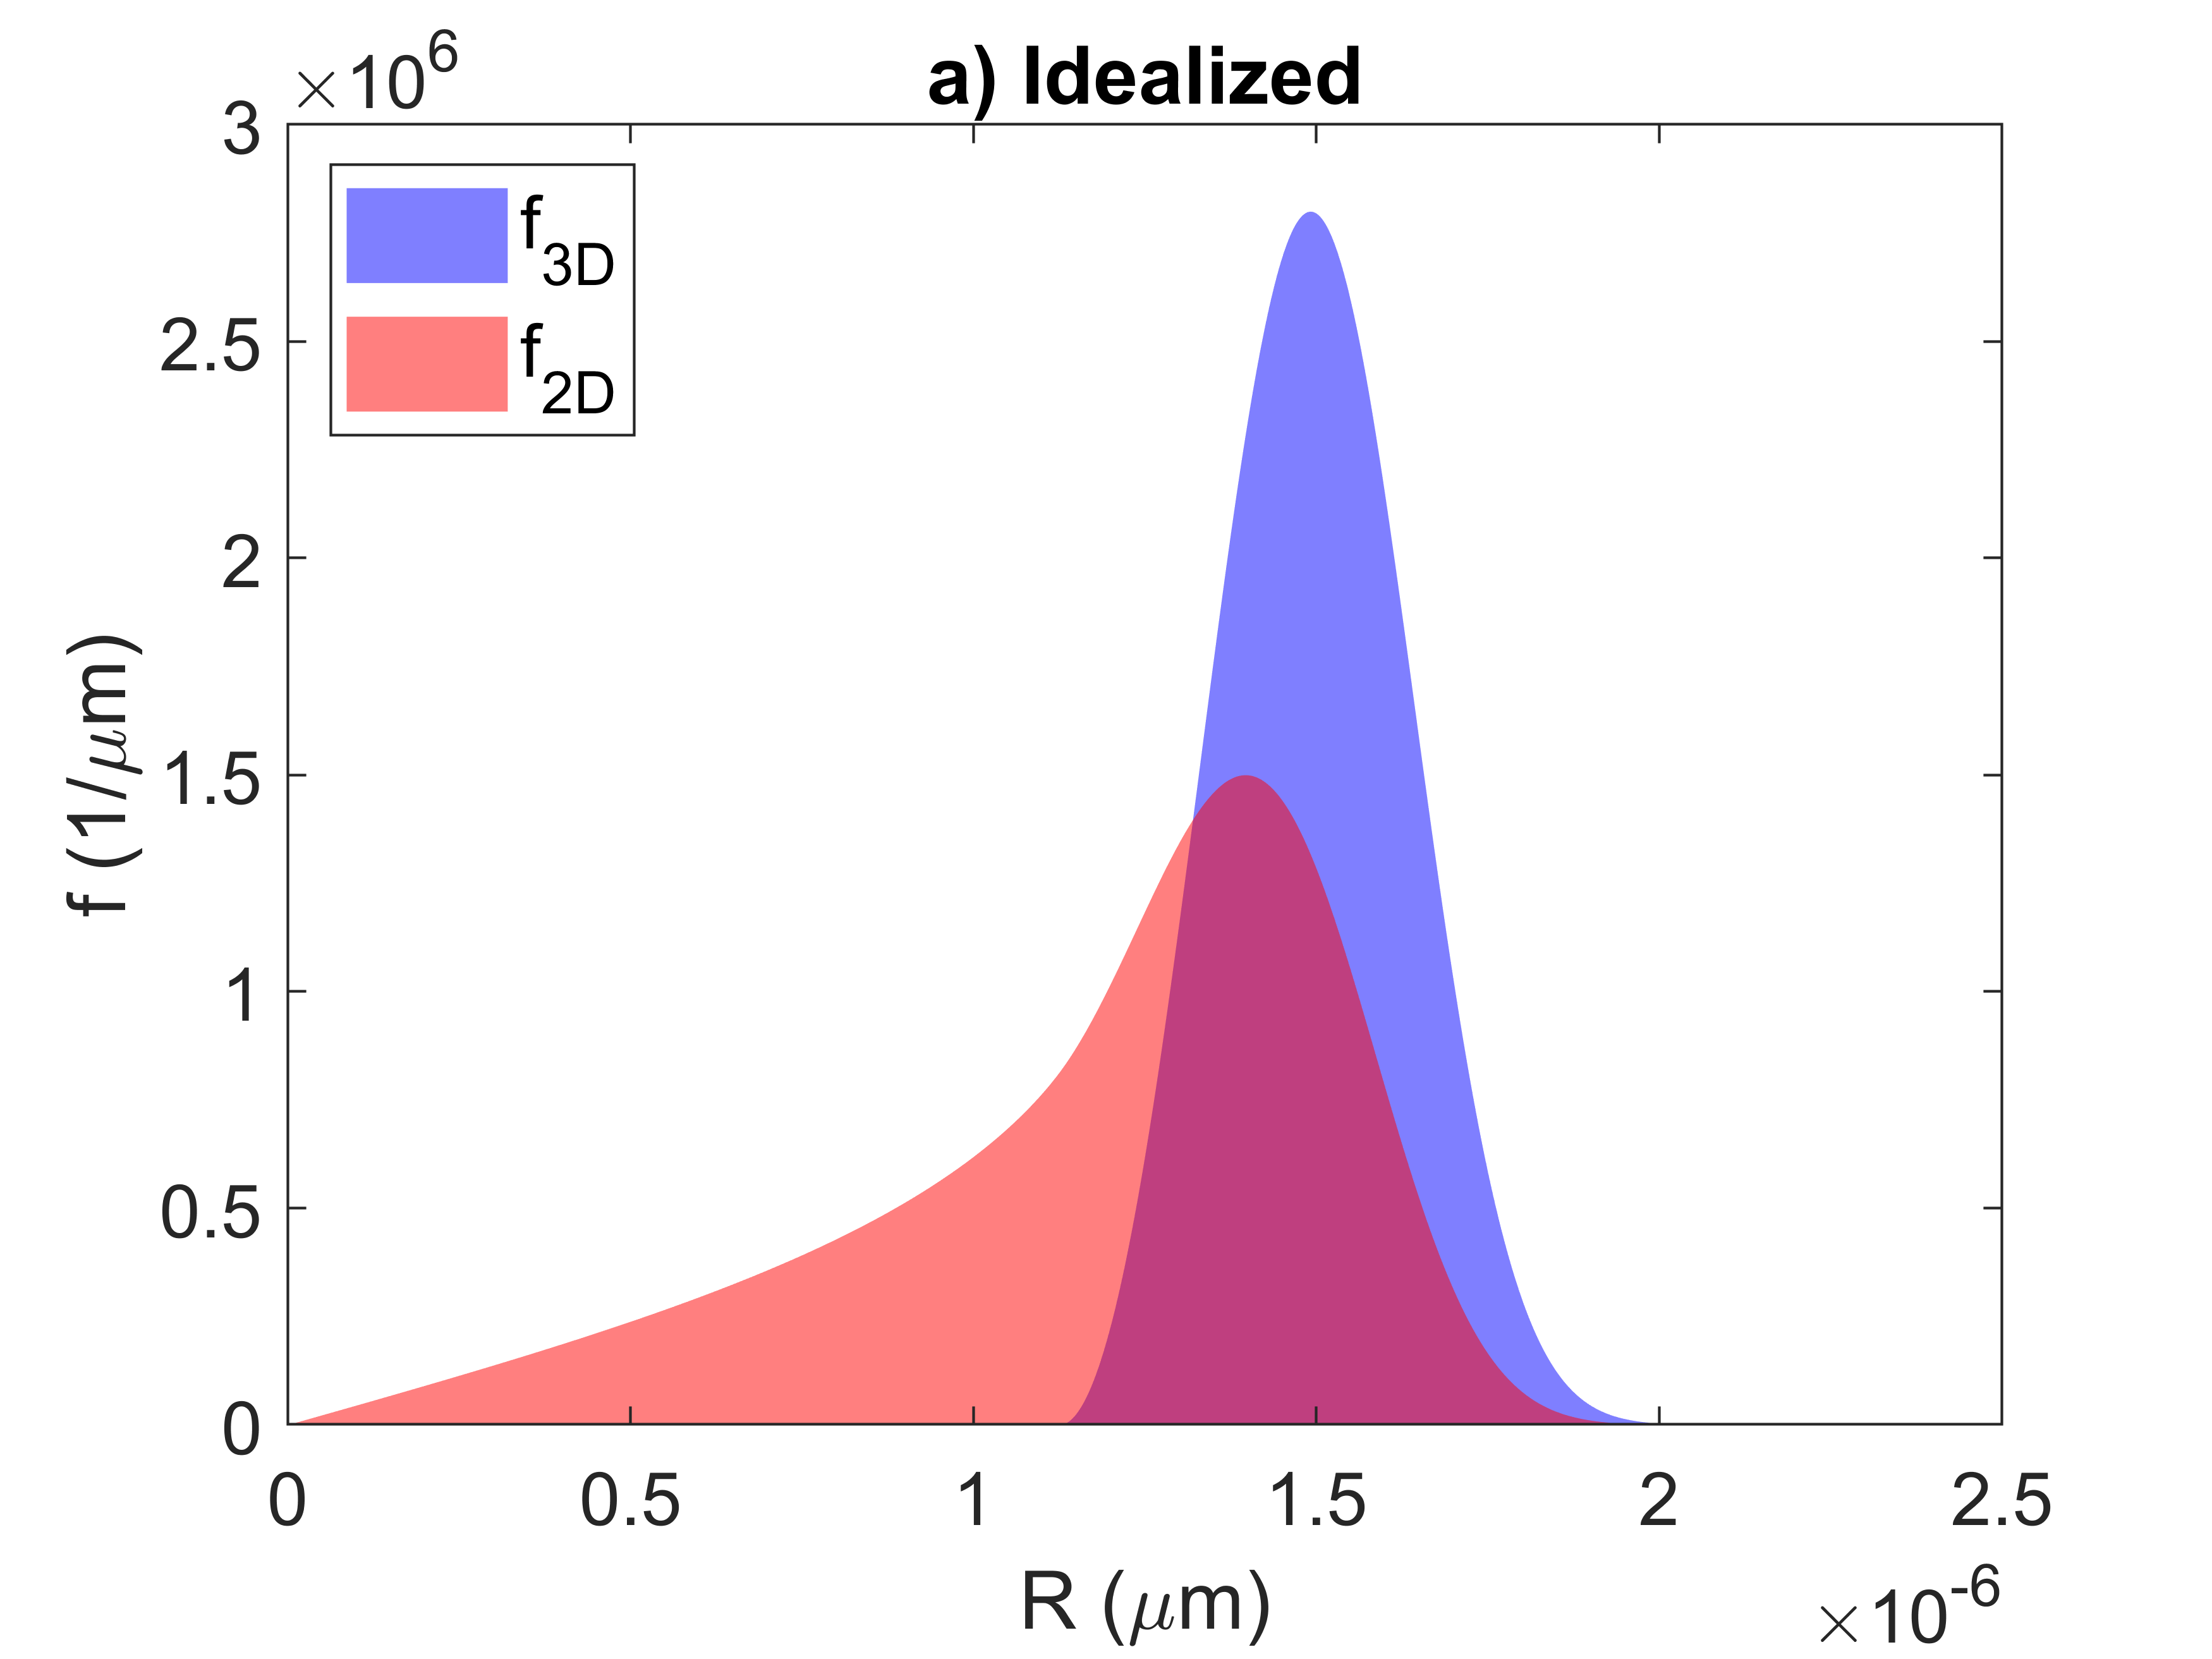
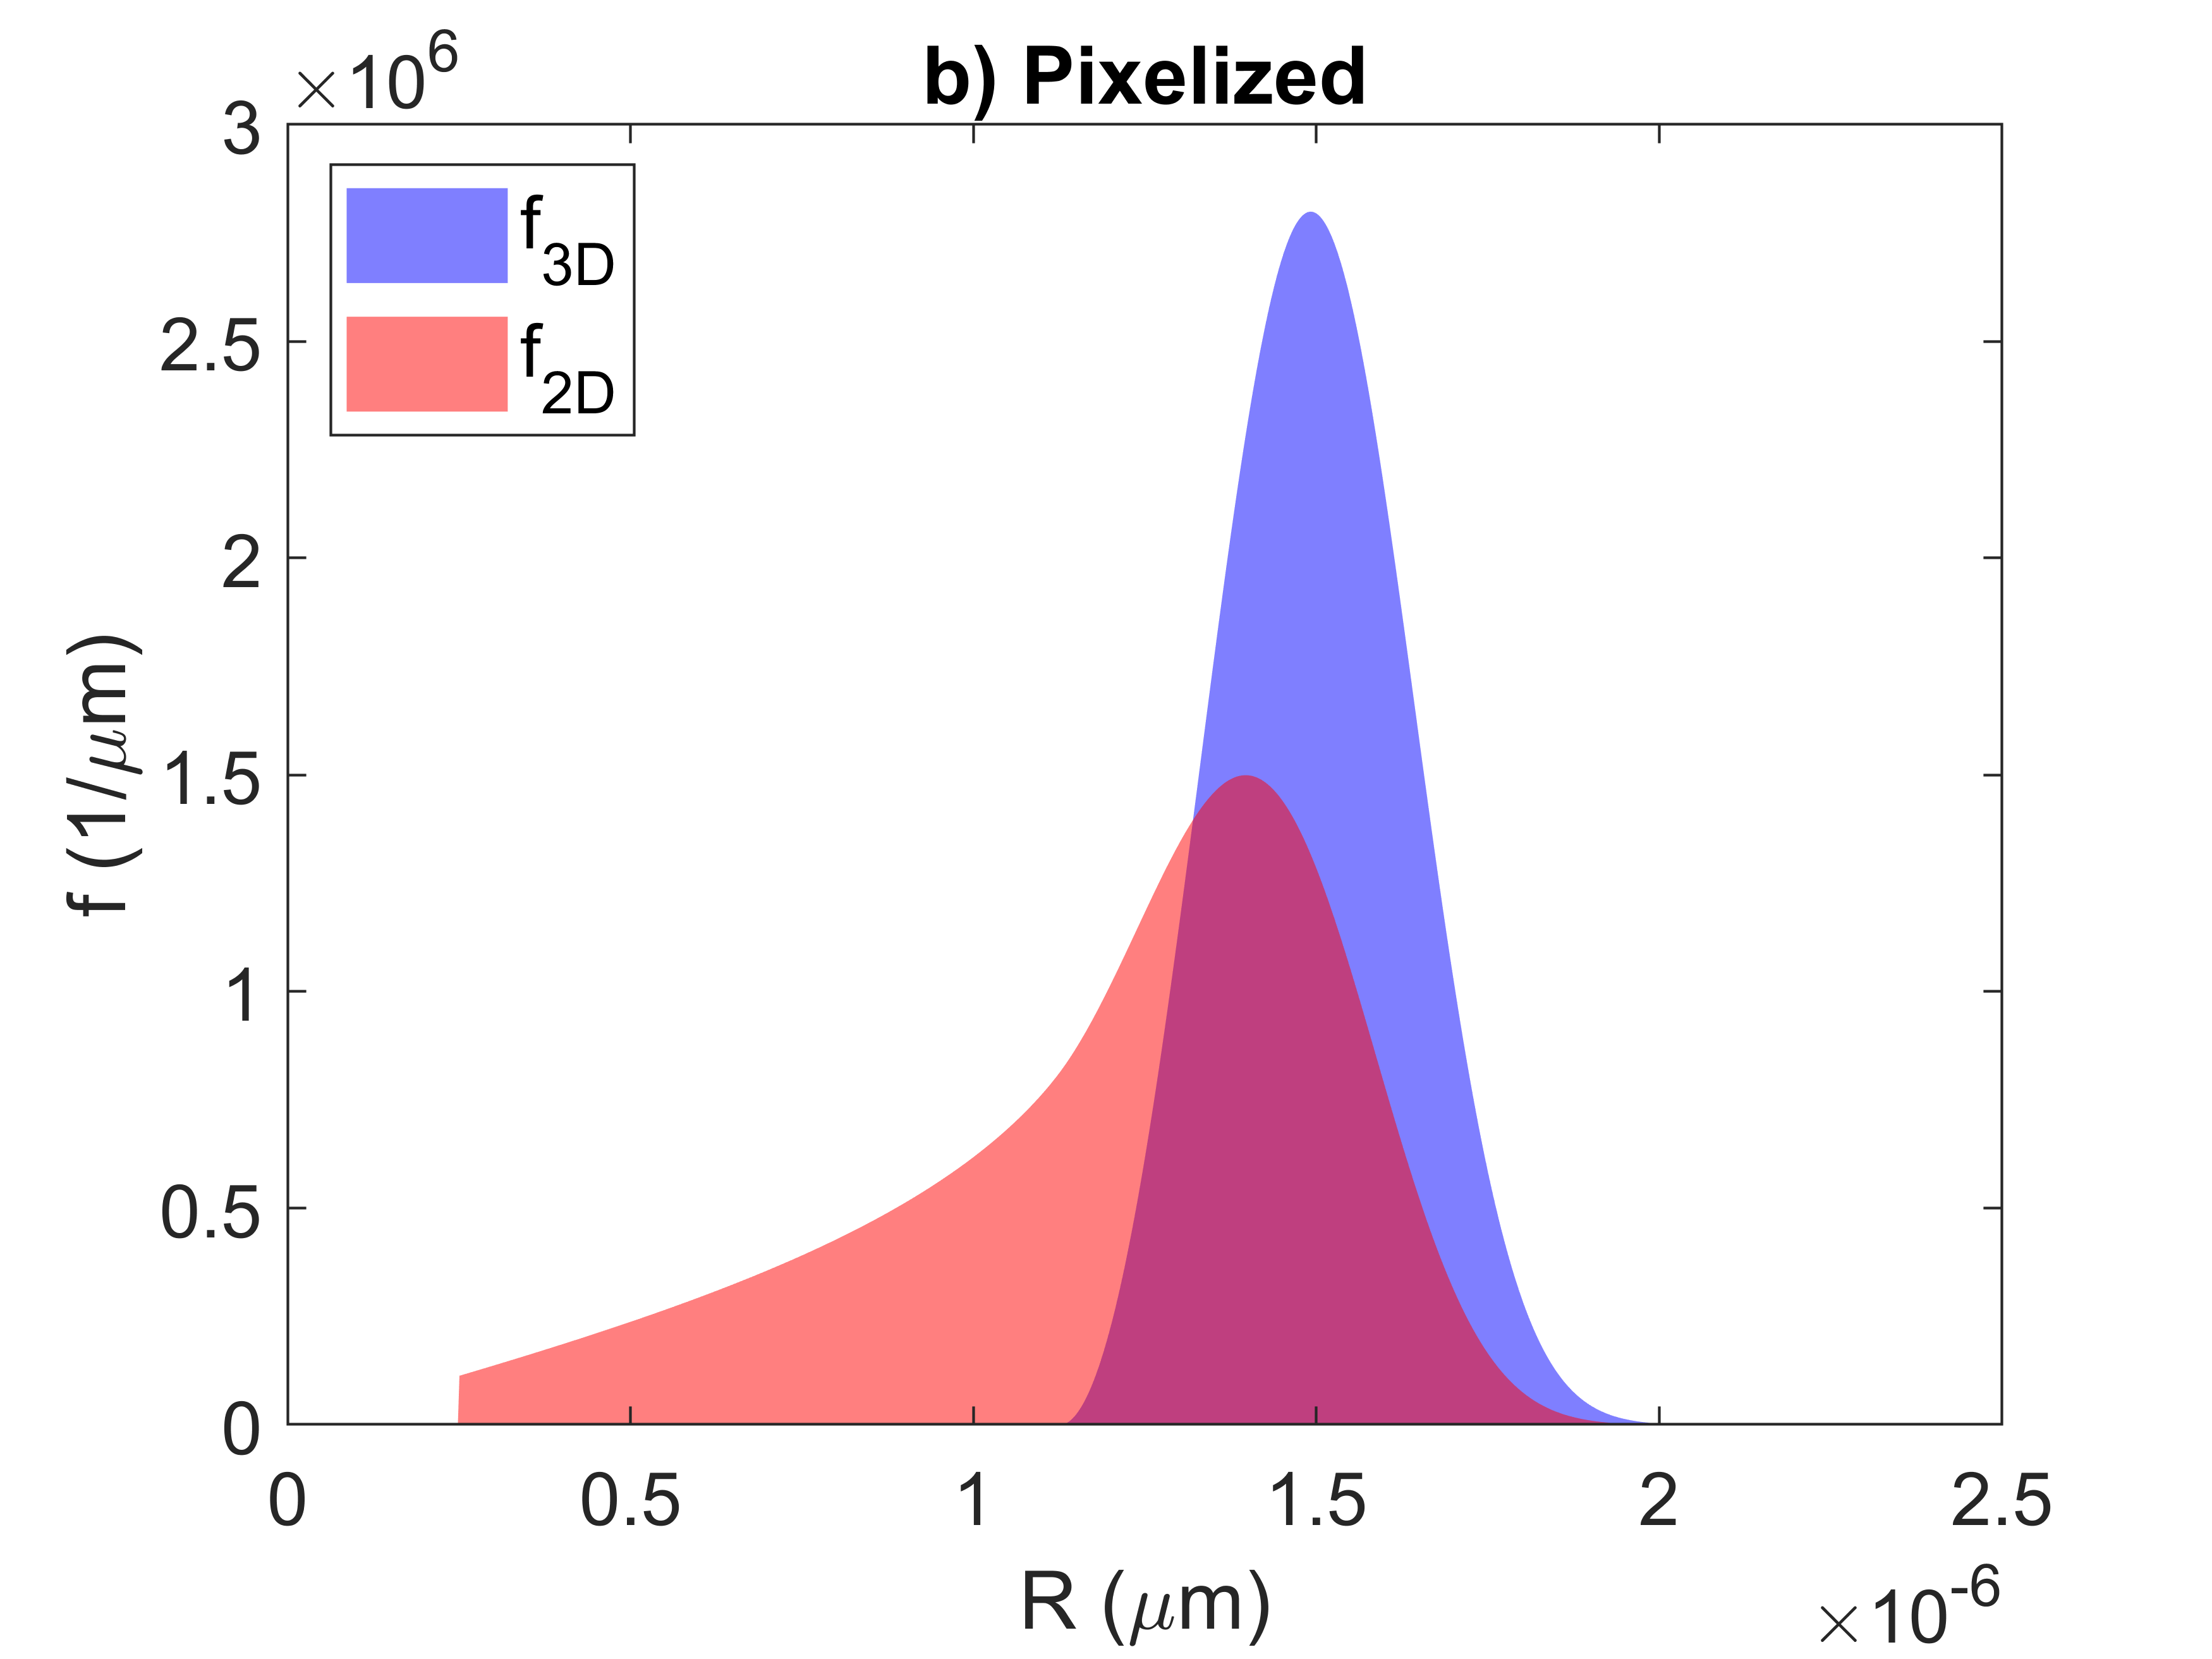
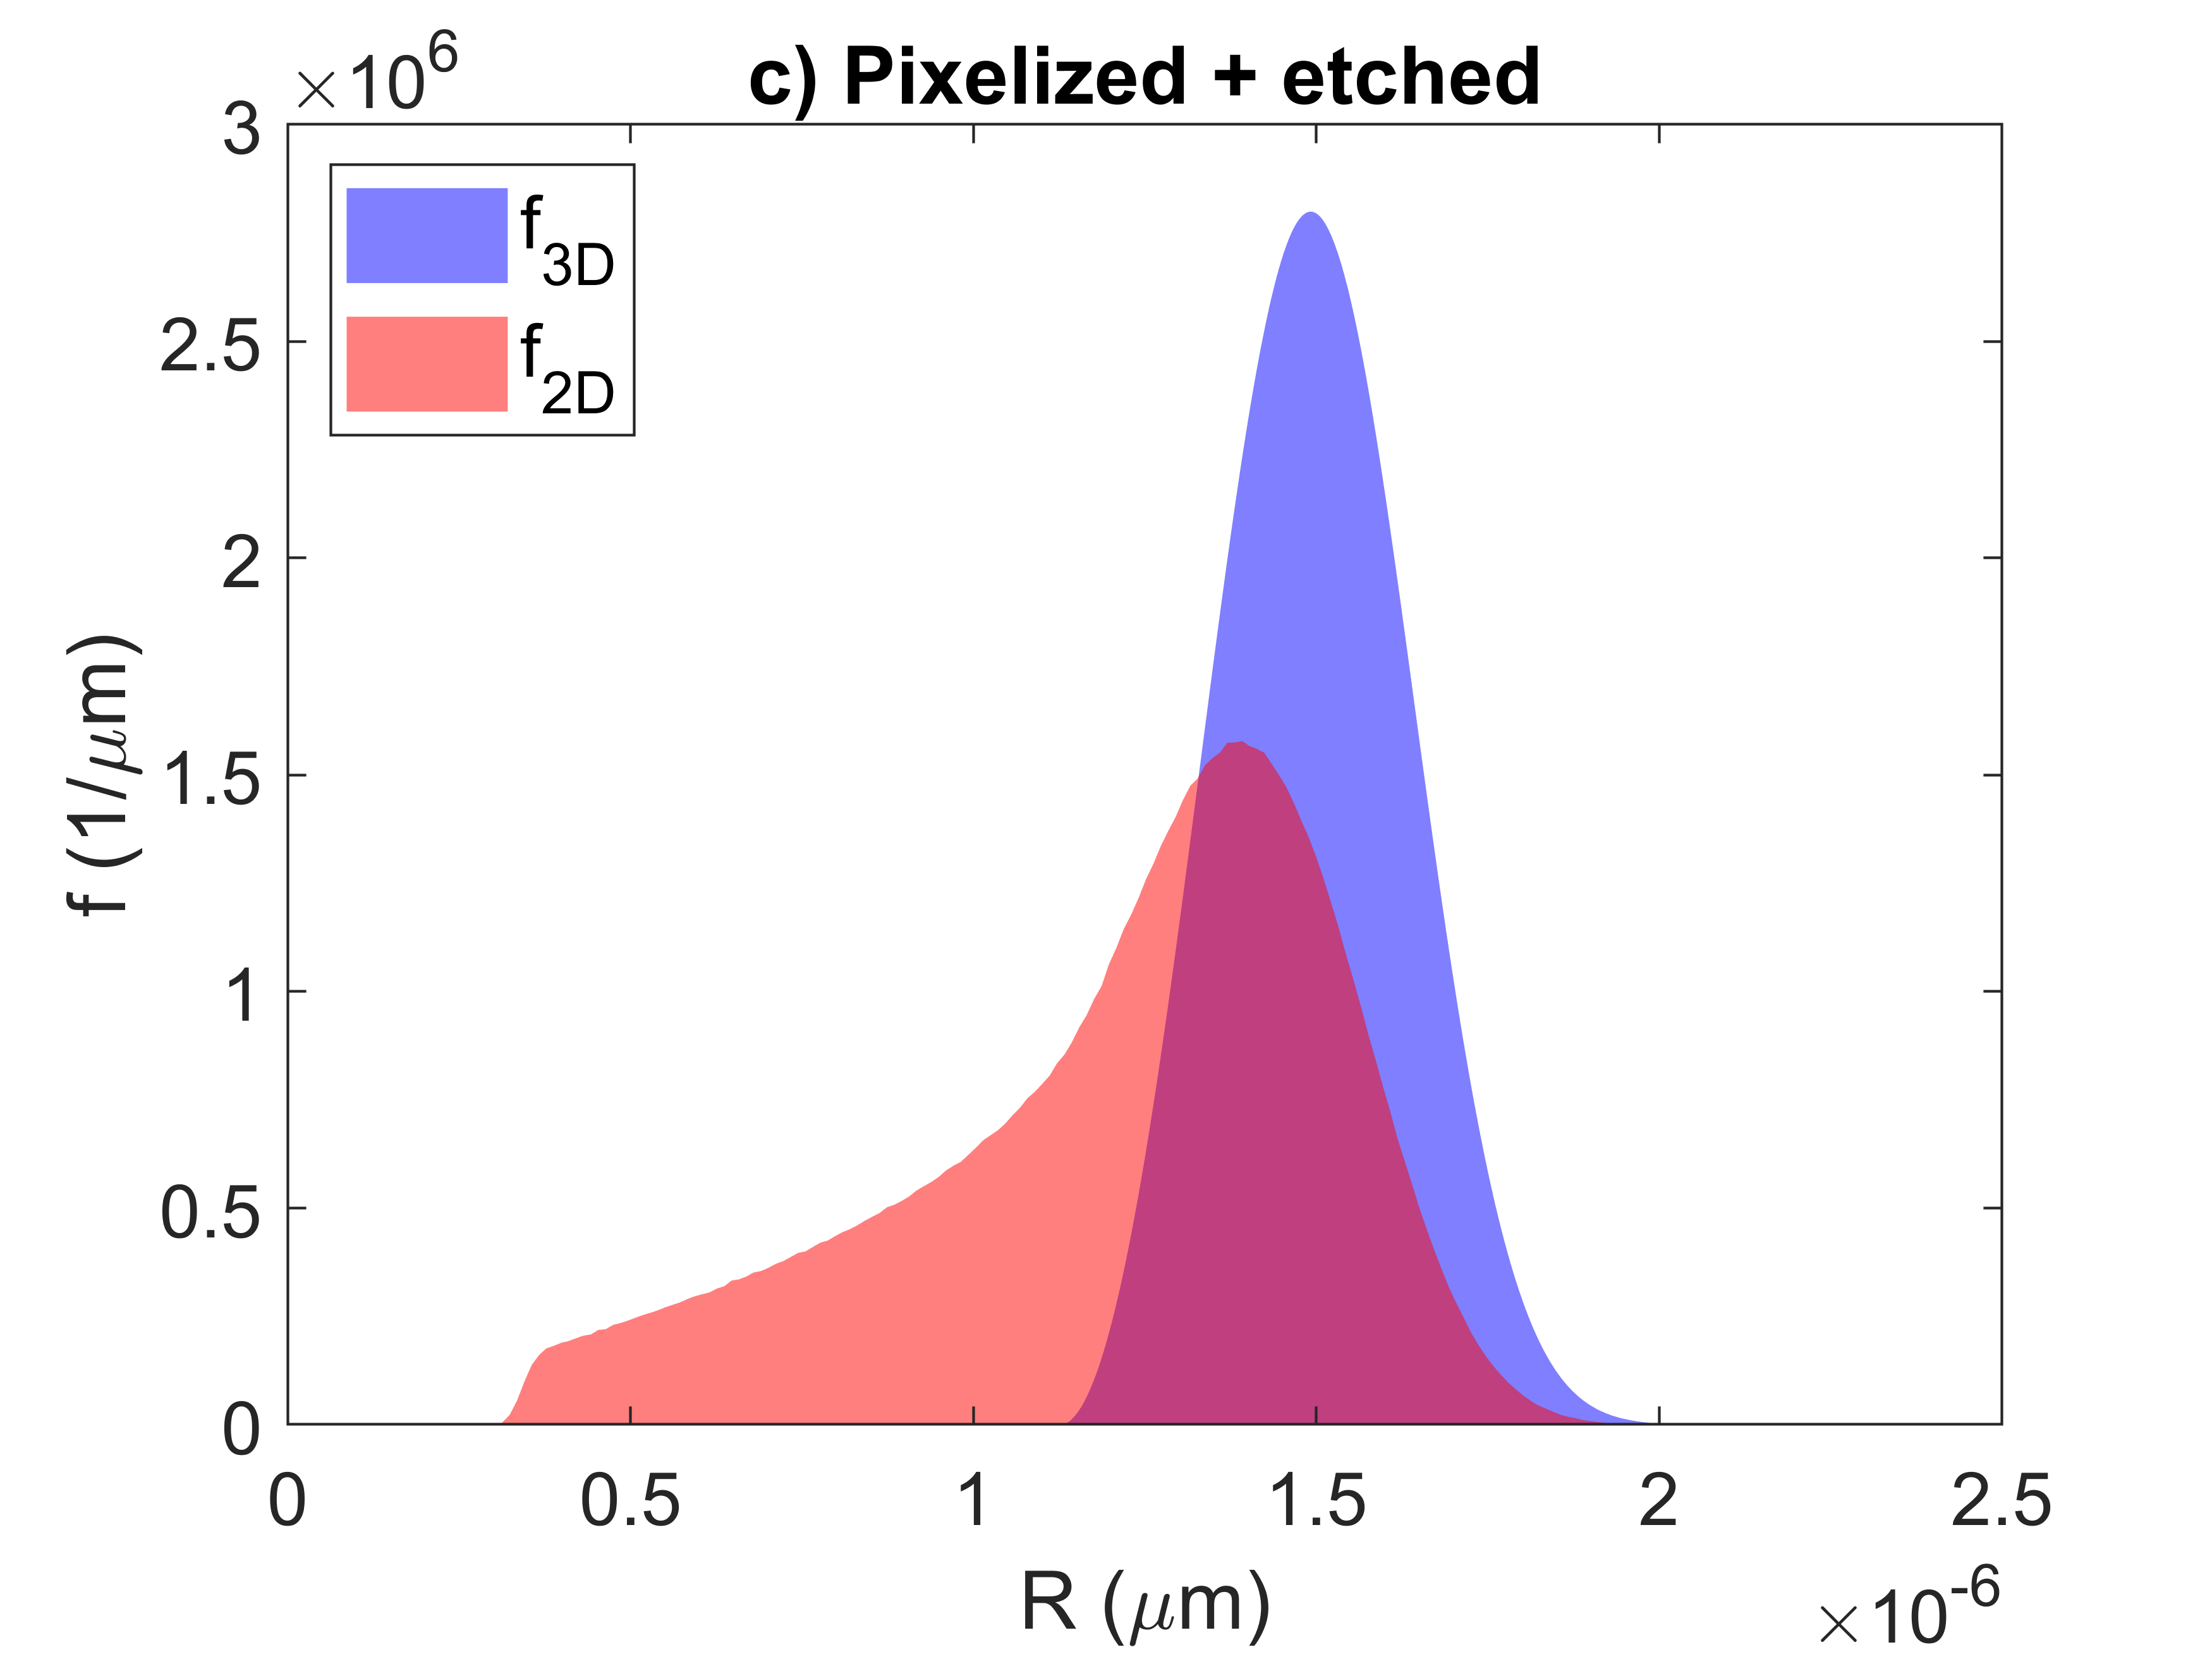
It is assumed that the 2D cross-section is a perfect cut through the material however there may be some error in this approximation. Figure 5 presents the idealized case with a 3D and 2D size distribution with a mean radius of 1.5 µm. In Figure 6, it is assumed that the minimum size of particles that can be quantified in the micrograph is 0.25 µm. This crops off the left-hand tail of the 2D distribution. Etching away the matrix reveals sub-surface particles. Figure 7 shows the impact of etching a depth of 30 nm, further exposing particles that have a center below the cross-section of the cut.
Figure 6: Potential causes of error in micrographs showing the cropped left-hand tail caused by a limiting size that can be measured from the micrograph.
Figure 7: Potential causes of error in micrographs showing how the left-hand tail can be blurred due to etching.
References
[1925Wic] S. D. Wicksell, The Corpuscle Problem. A Mathematical Study of a Biometric Problem. Biometrika. 17, 84–99 (1925).
[1958Sal] S. A. Saltykov, Stereometric metallography (Metallurgizdat, Moscow, ed. 2nd, 1958).
[2011Jep] J. Jeppsson, K. Mannesson, A. Borgenstam, J. Ågren, Inverse Saltykov analysis for particle-size distributions and their time evolution. Acta Mater. 59, 874–882 (2011).
