AM_05: Using AM Calculator Probe Data with the Diffusion Module (DICTRA)
The microstructure of a hot-work tool steel additively manufactured using laser powder-bed fusion (L-PBF) is studied in detail by microstructure characterization and computational thermodynamics and kinetics by C.-Y. Chou et al. [2021Cho].
This example demonstrates the application of adding probes to an AM Calculator and then using this data via the Thermal Profile that is set up on a connected Diffusion Calculator. The example also uses a Scheil Calculator to collect some materials data that is then further used with the AM Calculator prior to using the probe data generated by the AM Calculator.
- Folder: Additive Manufacturing
- File name:
AM_05_AM_Probe_to_Diffusion.tcu
A separate license is required to perform calculations with the Additive Manufacturing (AM) Module. This example also requires a license for the Diffusion Module (DICTRA), plus additional database licenses for the TCS Steel and Fe-alloys Database (TCFE) (TCFE13 and newer), and the TCS Steels/Fe-Alloys Mobility Database (MOBFE) (MOBFE8 and newer).
Background
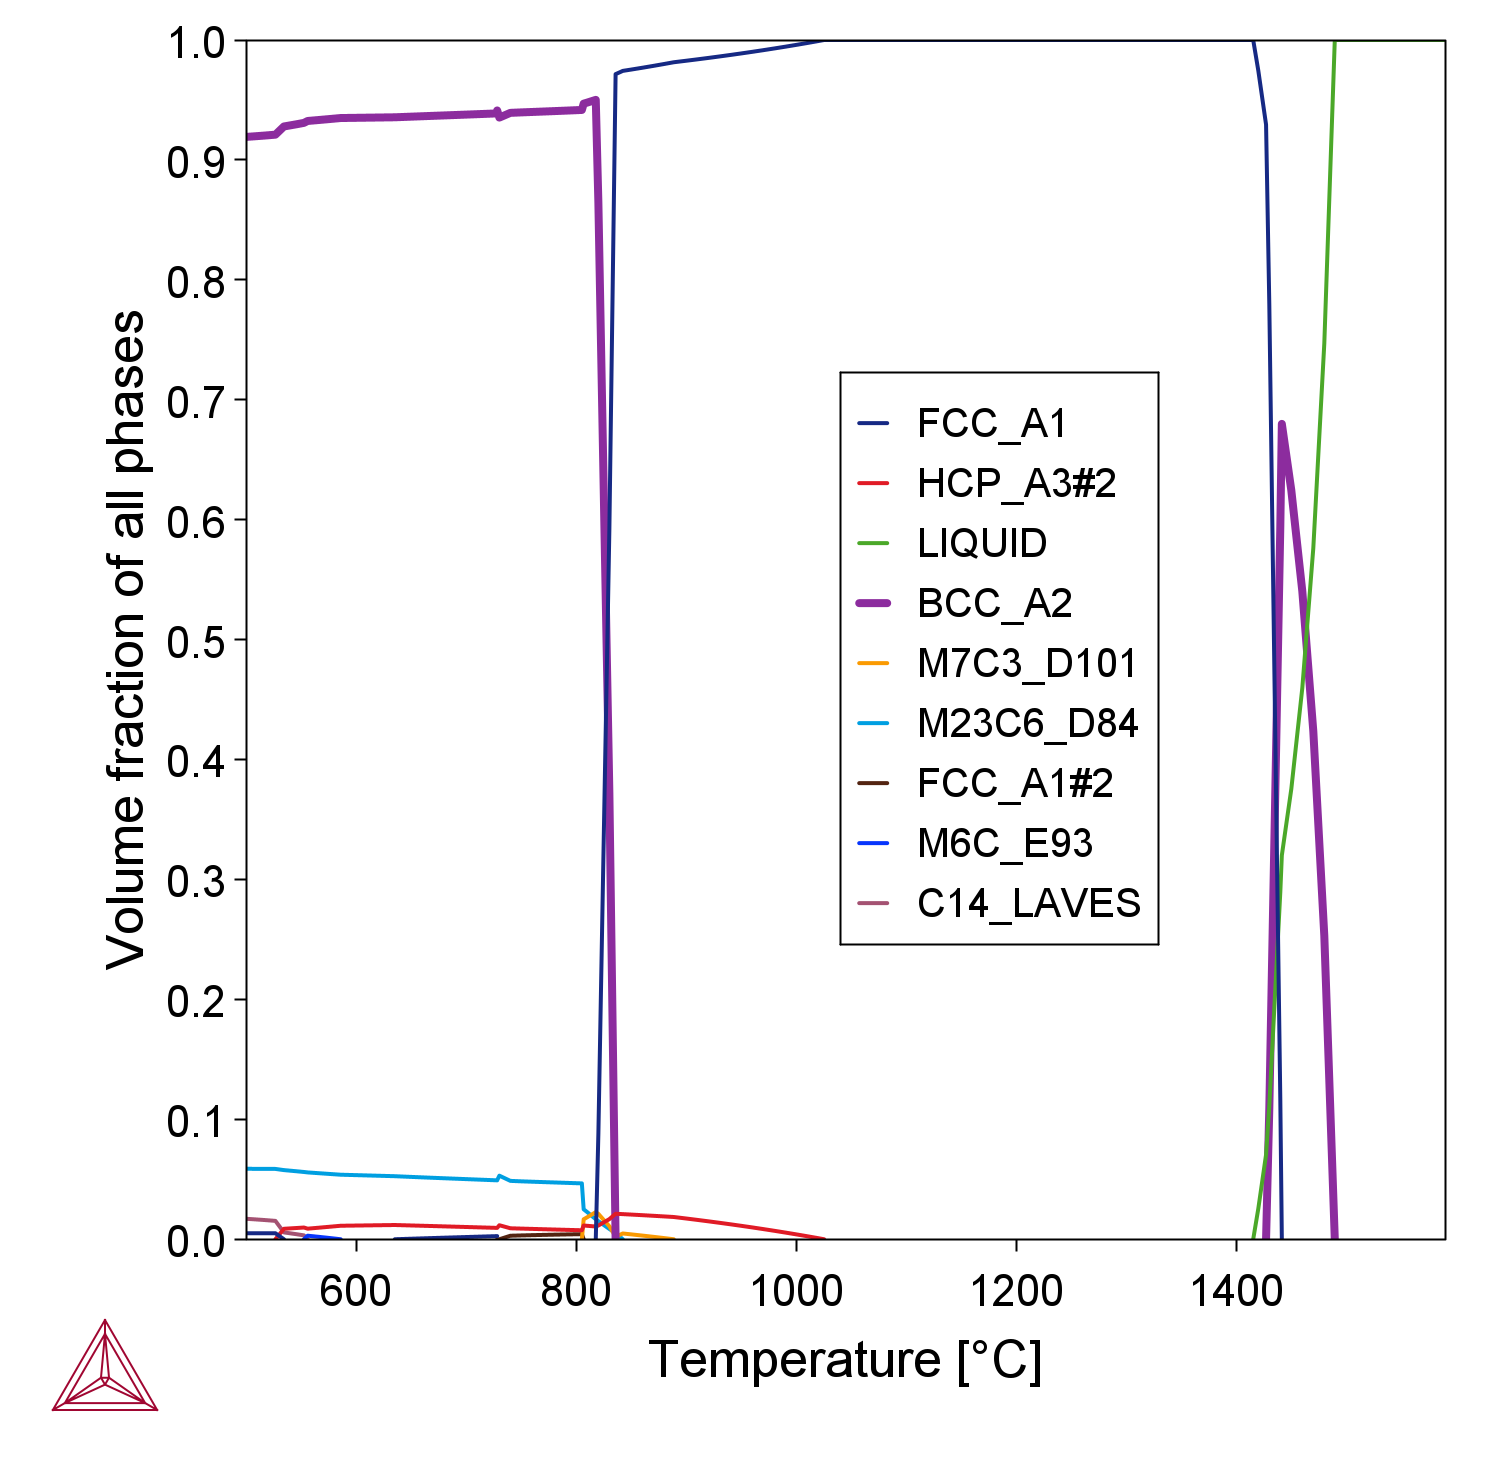
According to the thermodynamics of this steel, δ-ferrite is the solid phase stable at the highest temperature and would be the first solid phase to form during solidification from a thermodynamic point of view, see Figure 1.
Figure 1: Equilibrium property diagram calculated in Thermo-Calc of the tool steel showing δ-ferrite would be the first solid phase to form during solidification according to equilibrium.
However, the high solidification and cooling rates during the L-PBF process lead to suppression of δ-ferrite and instead solidification of an austenite phase directly containing a cellular substructure where the alloying elements have segregated to the inter-cellular regions.
The microsegregation can be predicted by reducing the complex solidification behavior to a diffusion problem in one dimension enabling comparisons with the measured segregation profiles quantified at a nanometer scale.
Configuration and Calculation Set Up
For all calculations, the simplified composition Fe-0.35C-4.93Cr-0.45Mn-2.24Mo-0.25Si-0.54V (mass%) was used with δ-ferrite suspended on the System Definer.
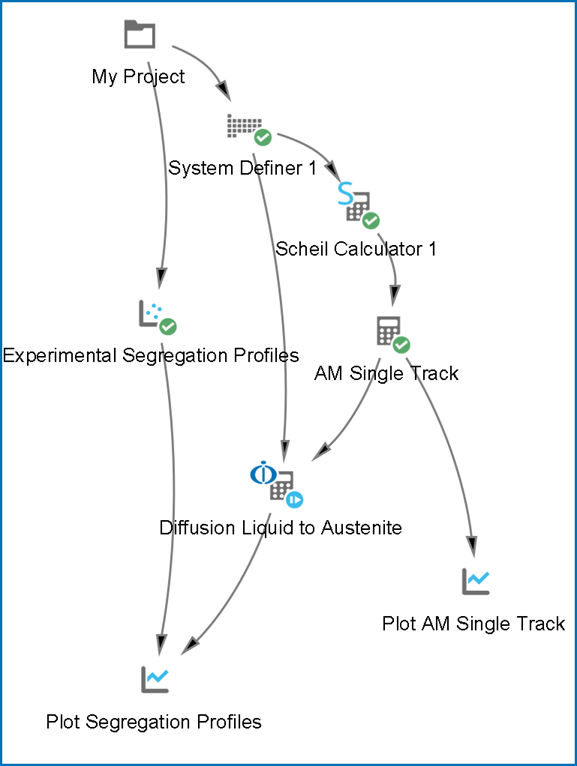
The Additive Manufacturing template was used to first add the System Definer, Scheil Calculator, AM Calculator, and Plot Renderer to the Project window tree. Additionally, a Diffusion Calculator was added as a successor to the AM Calculator in order to automatically import the time-temperature profile from the AM simulation into the diffusion simulation. See Figure 2 (or refer to the example if you have it open) to see the layout.
Figure 2: Project tree of the example containing activities from the default Additive Manufacturing template with additional Diffusion Calculator and Experimental File Reader nodes added, where the segregation profiles datasets are pulled from the Experimental File Reader.
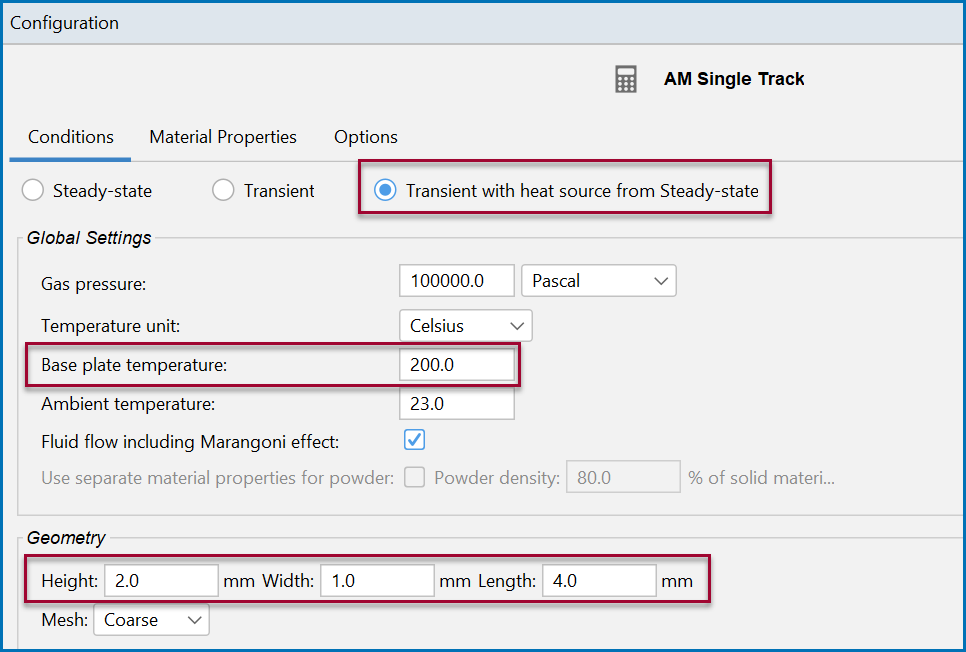
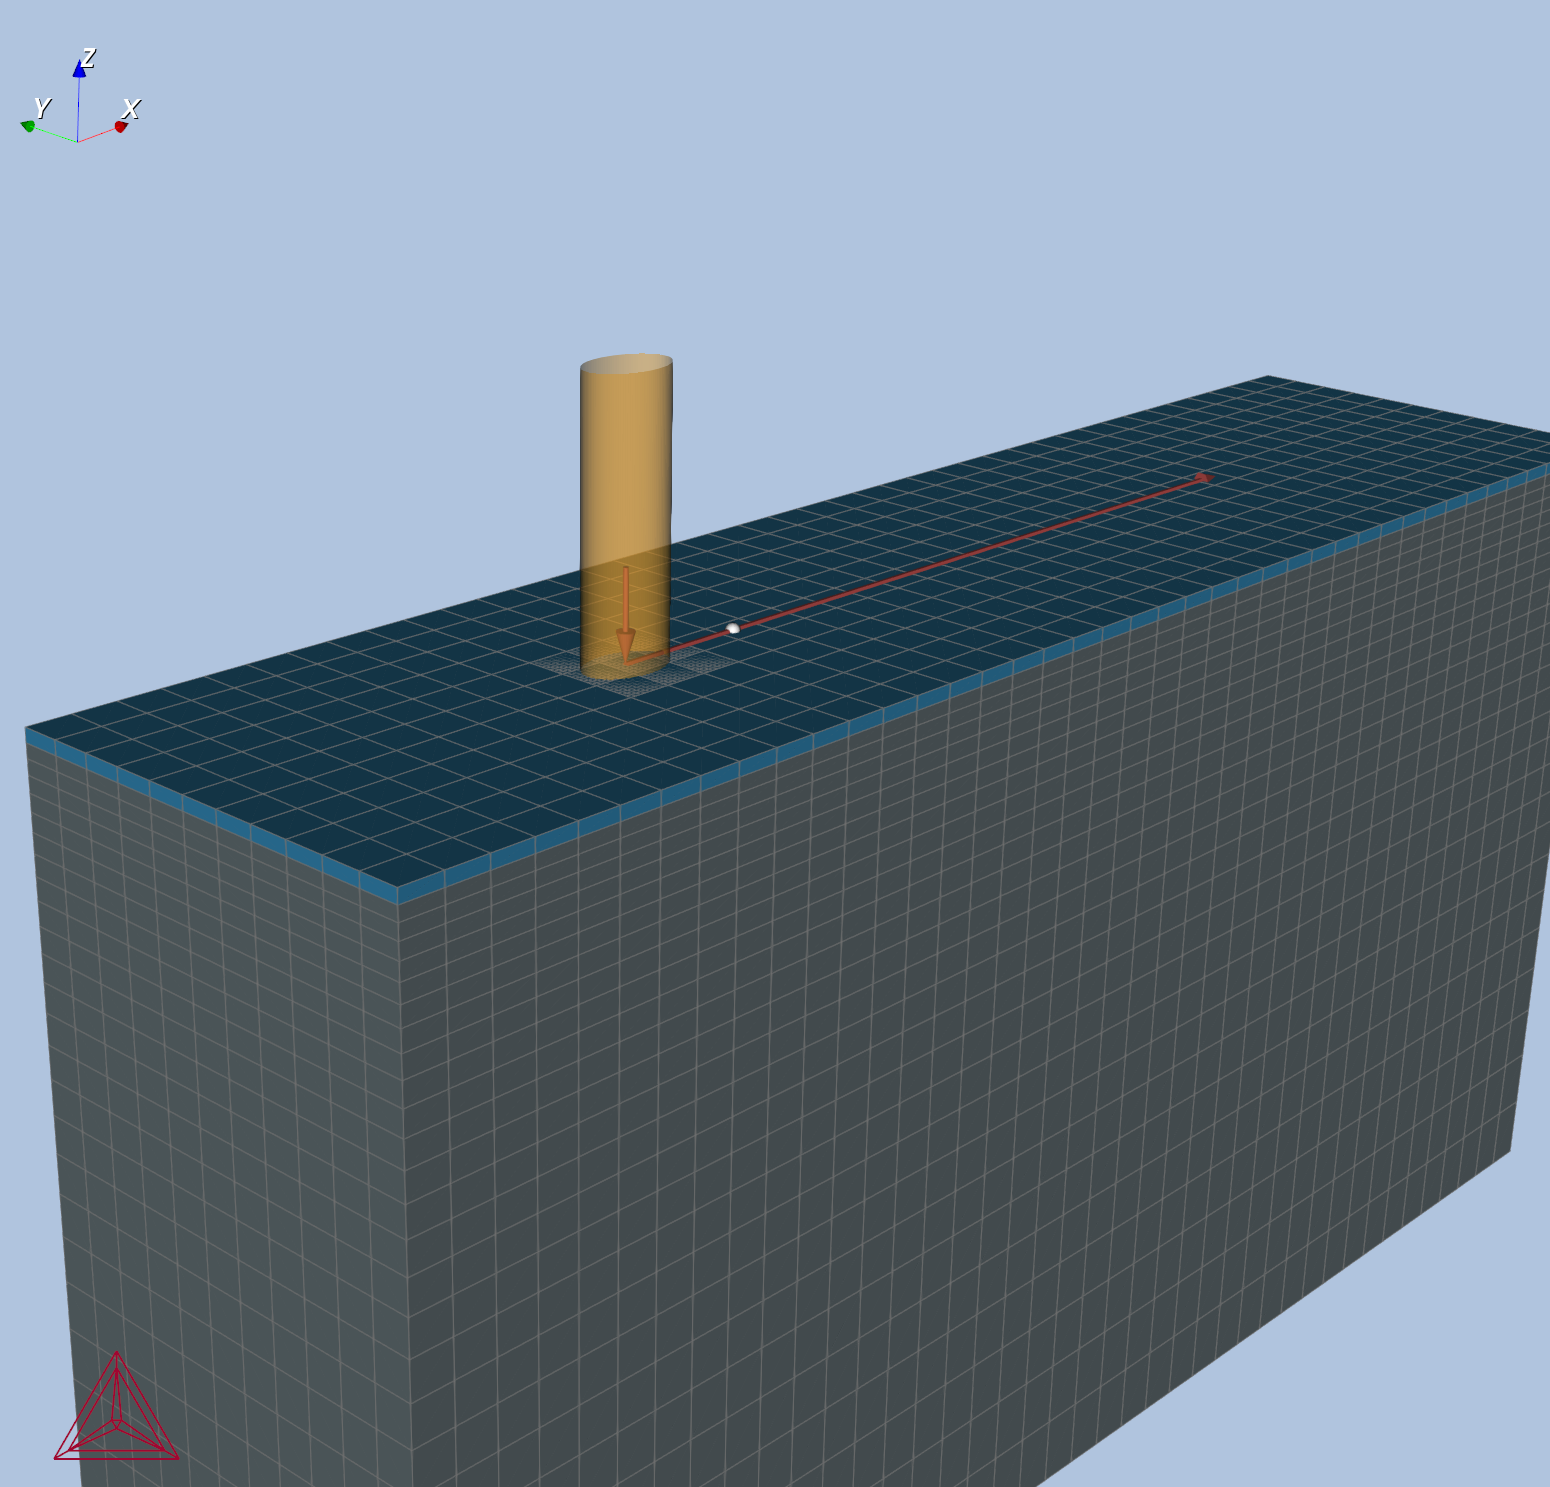
On the AM Calculator Configuration window, the calculation type Transient with heat source from Steady-state is selected with a single track scan pattern and a Geometry of 2 mm x 1 mm x 4 mm (height x width x length). The Base plate temperature is set to 200 °C.
Additional settings are then made on the Configuration window as follows.
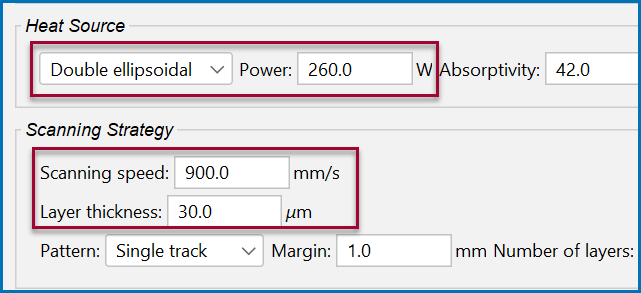
The Double ellipsoidal volume heat source was previously assessed as a function of linear energy density for a similar material and directly applied to the experimental conditions of a volumetric energy density of 80 J/mm3. The laser Power is entered at 260 W, Scanning speed at 900 mm/s, and powder Layer thickness 30 μm. Below is a snapshot of the settings.
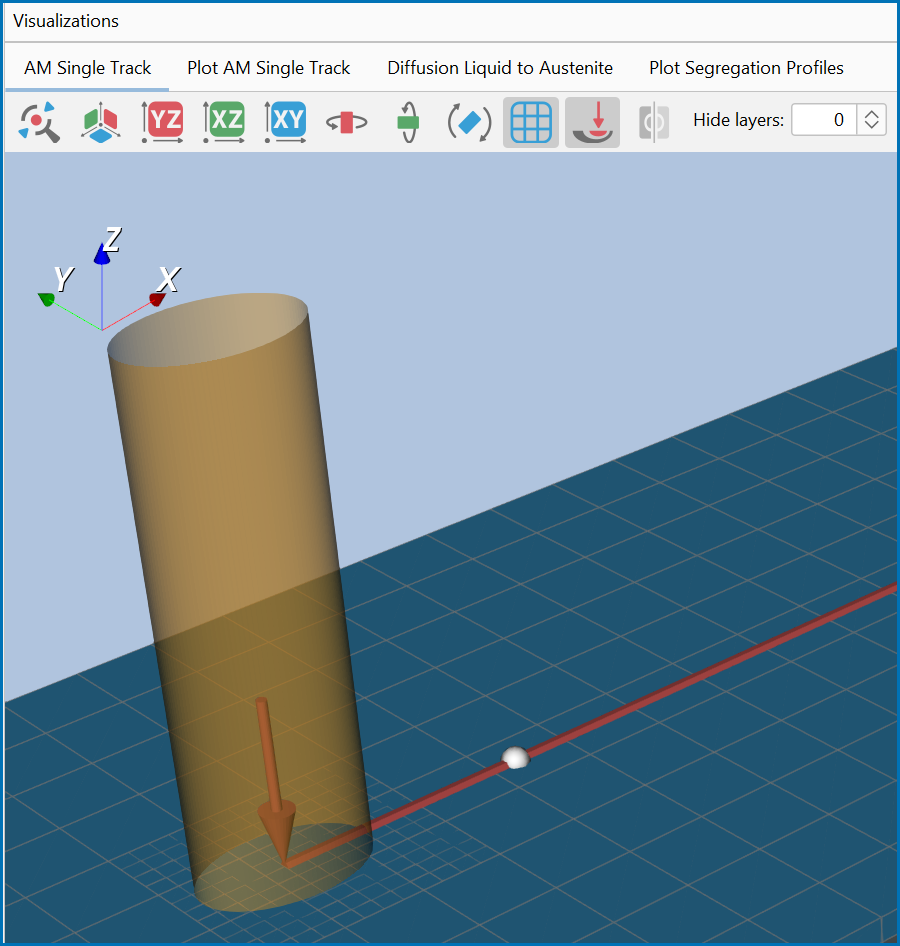
A probe was then added in the center of the scan track at a distance of 1.3 mm from the edge. The Probe Positions can either be entered directly on the Configuration window or click the Pick coordinate button and then click on the geometry in the Visualizations window to directly choose the probe point (or points if there is more than one probe added).

Figure 3: Close up of the probe point added to the geometry for the single track AM simulation.
Figure 4: The full geometry set up for the single track AM simulation with a probe point added to the middle of the scan. Open the example to better see the set up and to try working within the window.
Diffusion Calculations
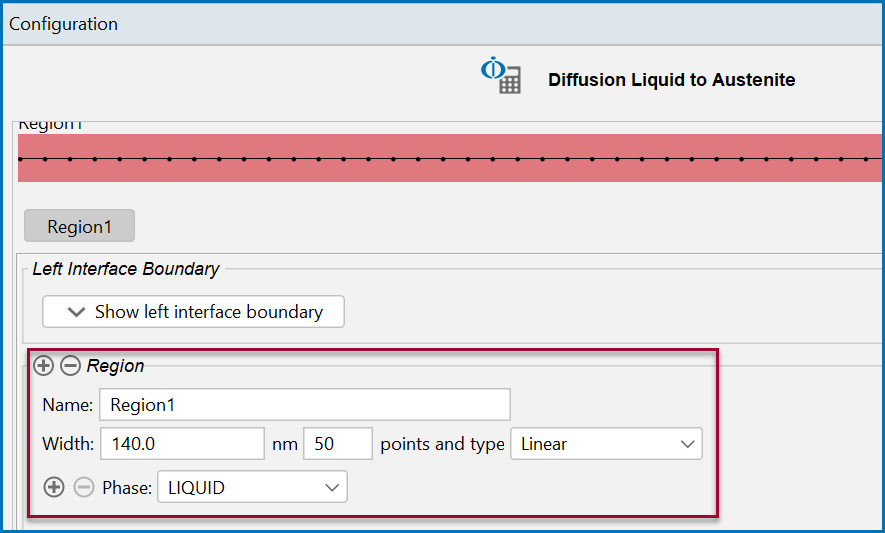
For the Diffusion Module (DICTRA) solidification calculations using the Diffusion Calculator, only the liquid to austenite (FCC) transformation was simulated. On the Diffusion Calculator Configuration window, a Region of 140 nm with liquid and FCC allowed to form at the right boundary is set.
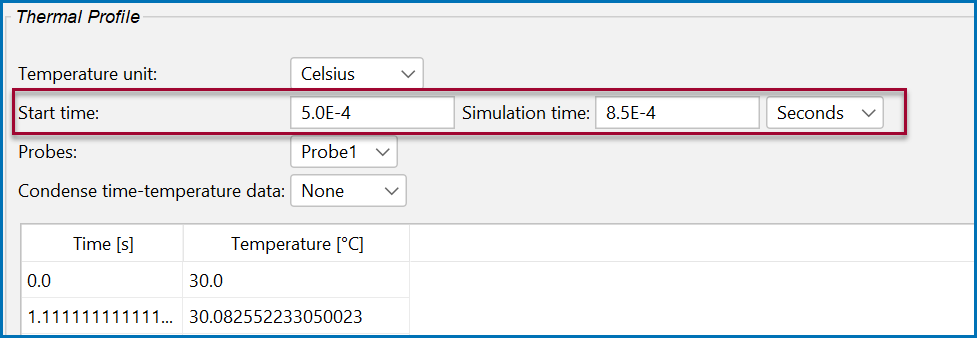
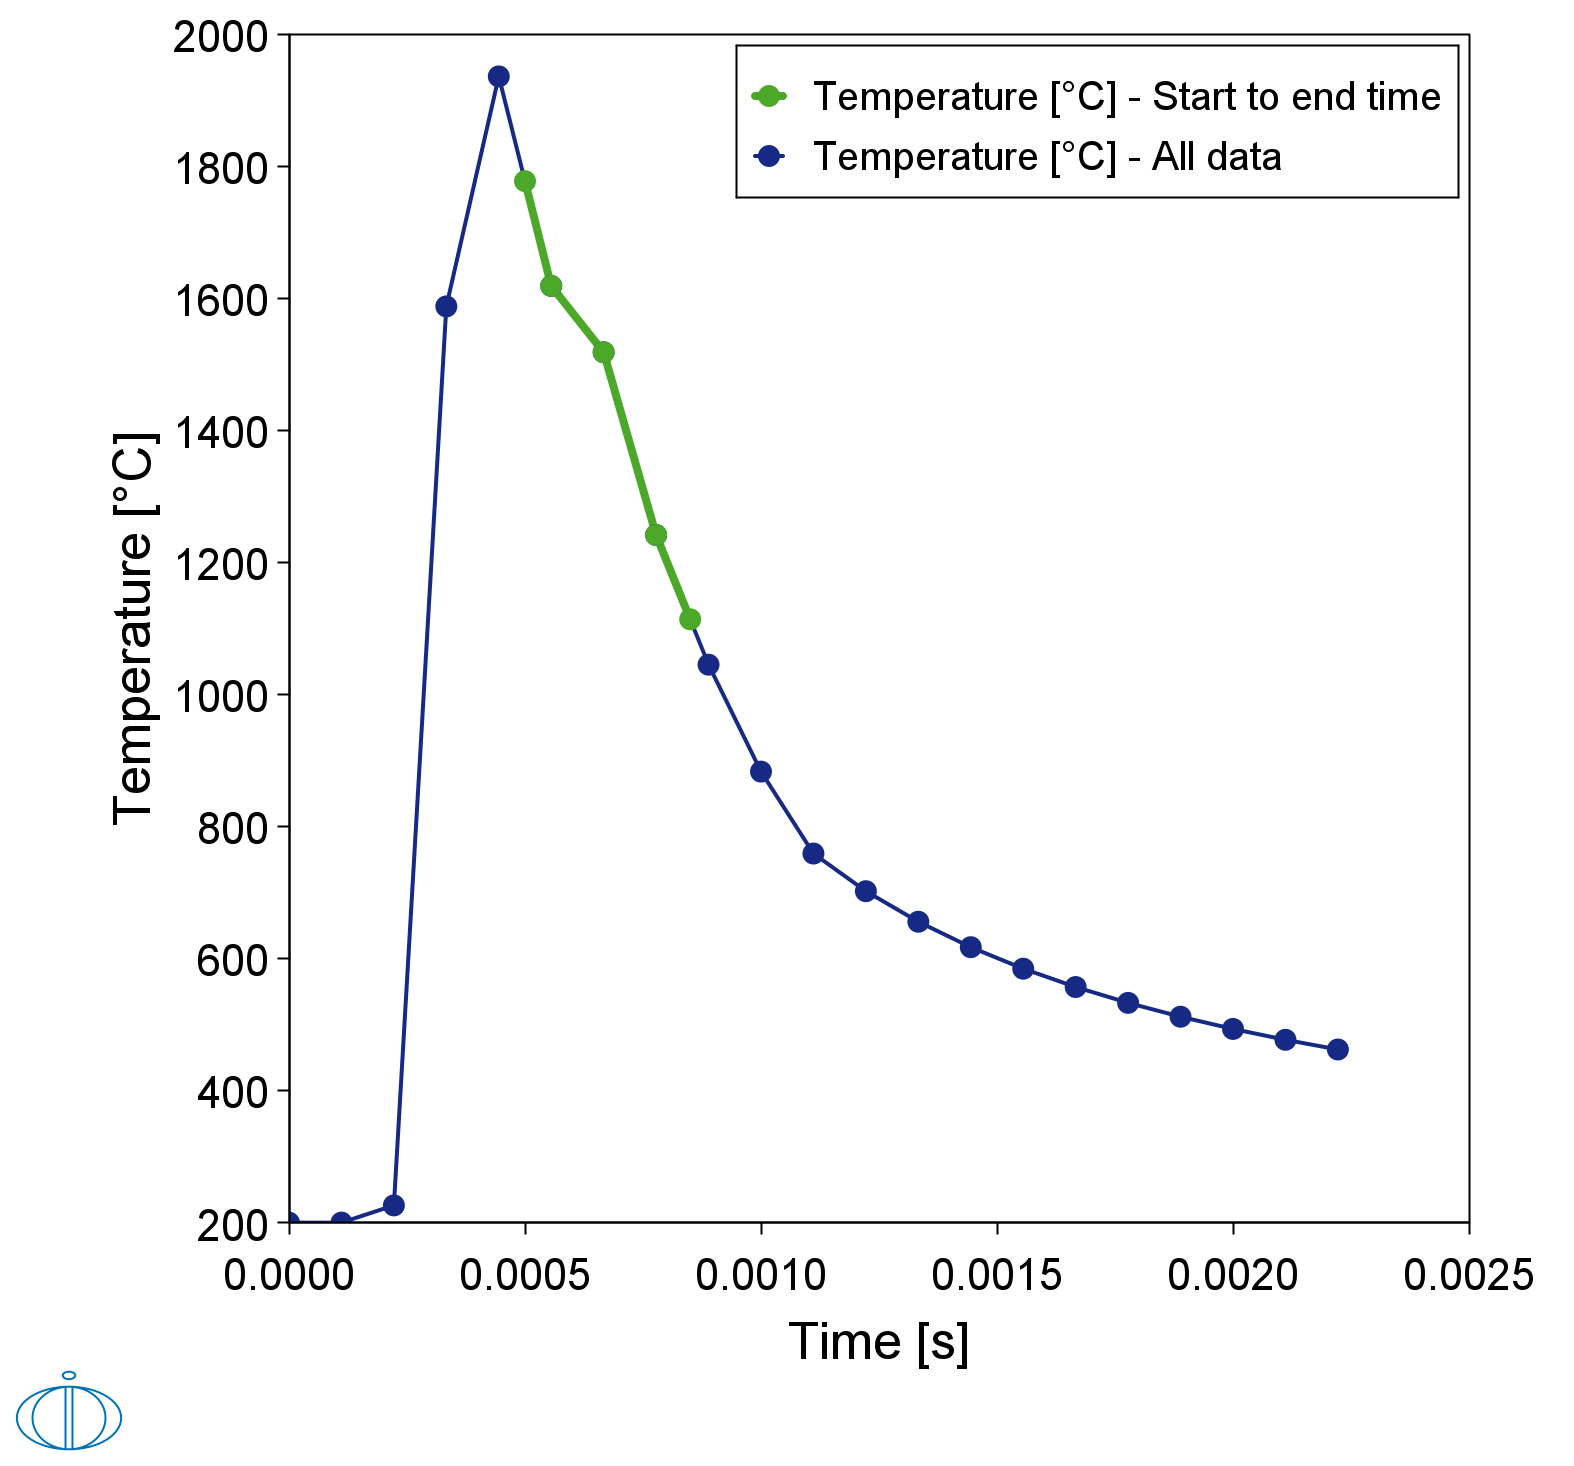
In the Thermal Profile section, the time temperature from the probe was selected between a Start time of 5.0E-4 and Simulation time of 8.5.0E-4 s in order to only simulate the solidification, which can be viewed on the Visualizations window as in Figure 5. Note that the probes need to be added and then run in the AM Calculator to make this data available in for this part of the calculation.
Figure 5: Time temperature profile of the probe in the AM simulation. The green curve show the part of the profile used during the diffusion simulation with the Diffusion Calculator.
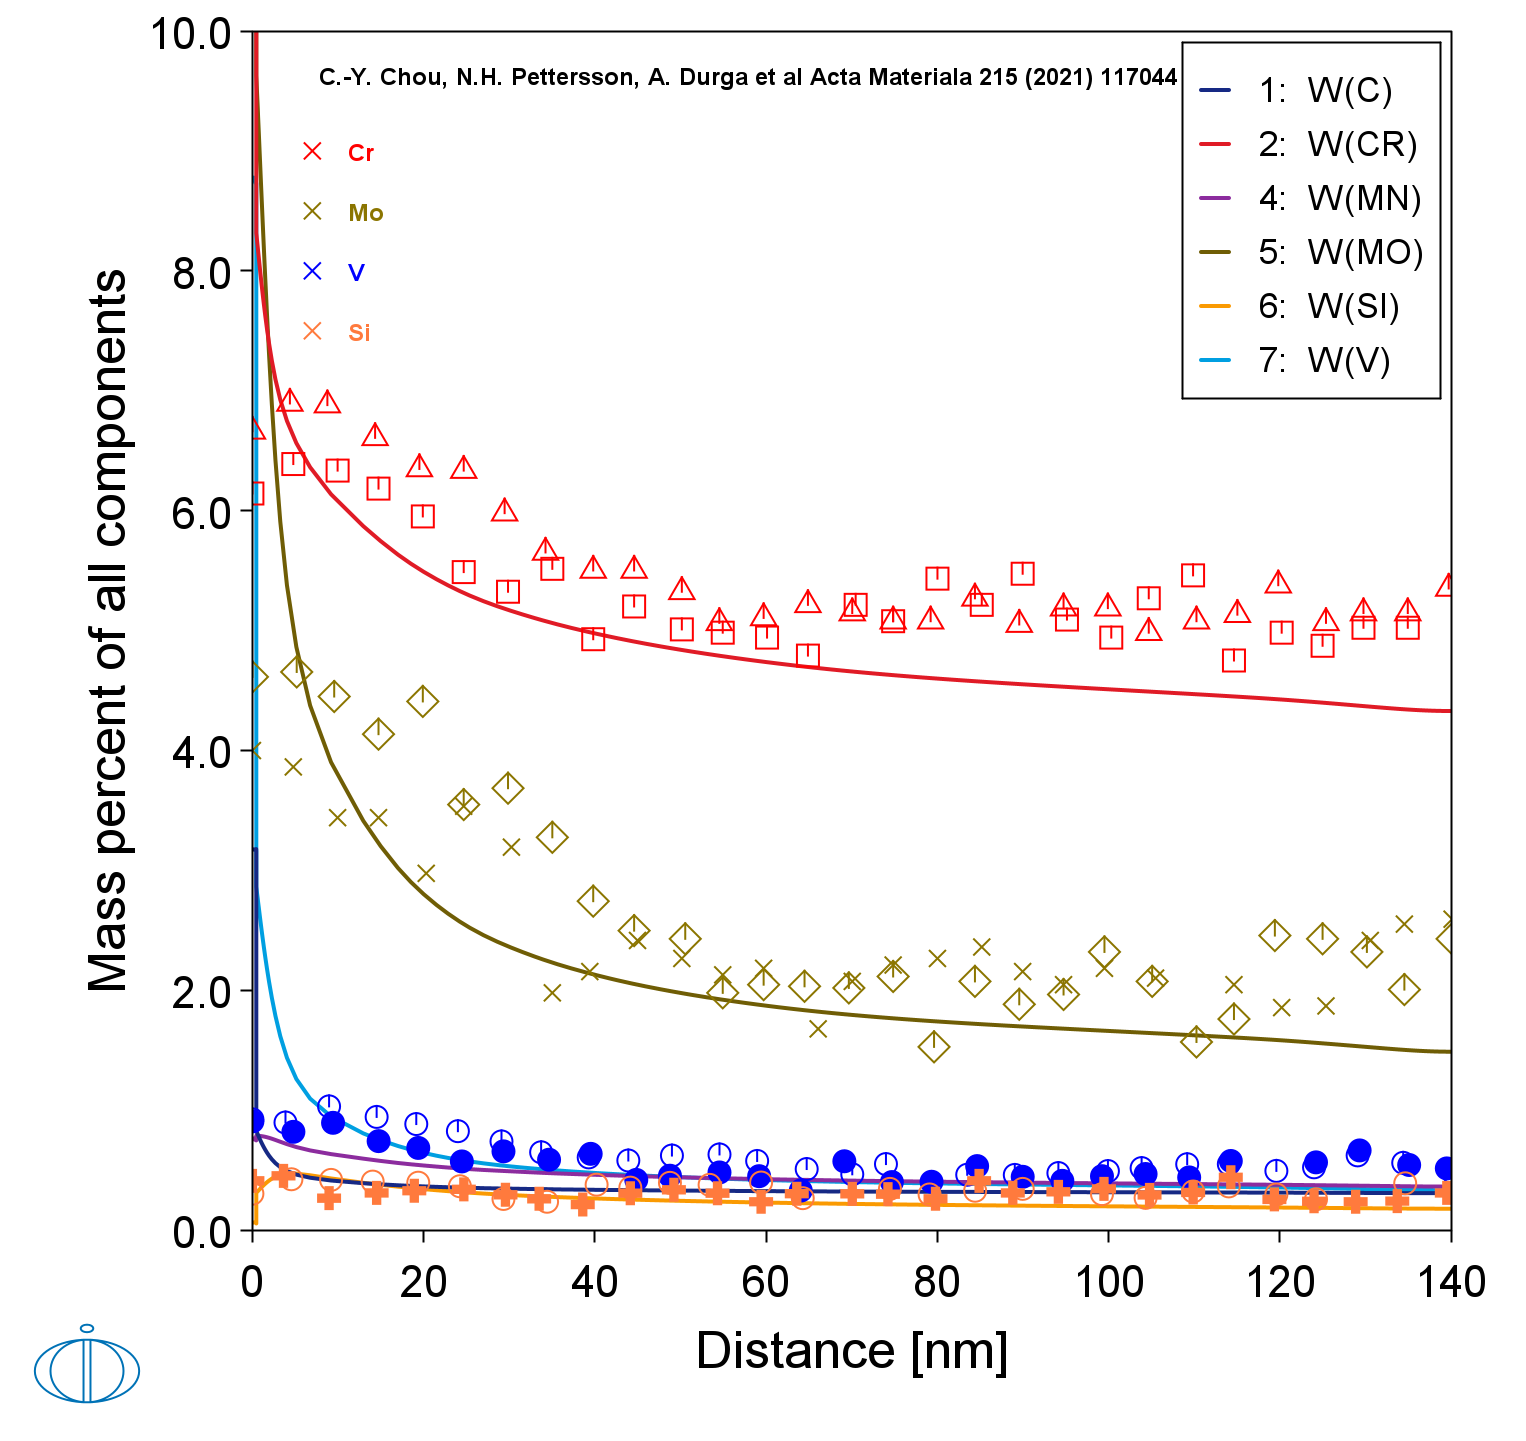
The calculated segregation profiles are finally compared with the STEM-EDS line scans as shown in Figure 6.
Figure 6: The simulated segregation profile with overlaid experimental STEM-EDS line scans from C.-Y. Chou et al. [2021Cho].
Visualizations
Open the example project file to review the node setup on the Project window and the associated settings on the Configuration window for each node. For some types of projects, you can also adjust settings on the Plot Renderer Configuration window to preview results before performing the simulation. Click Perform Tree to generate plots and tables to see the results on the Visualizations window.
When you run (Perform) this example, it can take over three hours to complete the calculations.
There is a variety of information shown in the Visualizations window that can be viewed during configuration and after performing the calculation(s). This example highlights some of these capabilities:
- Probes: Probes are added to the AM Calculator during the set up either by entering coordinates or directly adding these to the geometry. See Figure 3 and Figure 4 for example.
- Thermal Profile: The Diffusion Calculator Thermal Profile settings automatically include the probe data and you can visualize to help you continue the simulation. See Figure 5.
- Plot results: After completing the set up and performing the calculation, to view the matching name of the node on tab(s) in the Visualizations window, click a Plot Renderer node in the Project window or click the tabs individually in the Visualizations window. See Figure 6.
Reference
[2021Cho] C.-Y. Chou, N. H. Pettersson, A. Durga, F. Zhang, C. Oikonomou, A. Borgenstam, J. Odqvist, G. Lindwall, Influence of solidification structure on austenite to martensite transformation in additively manufactured hot-work tool steels. Acta Mater. 215, 117044 (2021).
Other Resources
Read more about the Additive Manufacturing (AM) Module on our website including the details about database compatibility or to watch an introductory webinar. You can also use the Getting Started Guide to learn about the key features available.
Many of our Graphical Mode examples have video tutorials, which you can access in a variety of ways. When in Thermo‑Calc, from the menu select Help → Video Tutorials, or from the main My Project window, click Video Tutorials. Alternately, you can go to the website or our YouTube channel.
