AM_03: Steady-state Simulations
The following example is part of a series showing some of the features of the Additive Manufacturing (AM) Module and the AM Calculator.
In this example steady-state simulations are performed for IN625 with different conditions i.e.
- without fluid flow in the melt pool,
- with fluid flow in the melt pool due to Marangoni effect, and
- using separate material properties for the powder.
and then the results are compared to demonstrate the effects of fluid flow and separate material properties for the powder on the temperature distribution as well as on the shape of the melt pool.
For the first two simulations, the same material properties are used for both powder and solid substrate while for the third simulation no fluid flow is included in the melt pool.
In steady-state simulations it is assumed that the heat source (laser beam) moves with a uniform speed relative to the base plate. In this case, the model is solved by modifying governing equations to a reference frame attached to a moving heat source. Furthermore, in steady-state mode you can make use of symmetry along the width of the geometry and solve for only half of the domain.
- Folder: Additive Manufacturing
- File name:
AM_03_Steady.tcu
A separate license is required to perform calculations with the Additive Manufacturing (AM) Module. Without a license you are in Demo Mode where you can, for example, open and view example set ups, run some examples, add templates and nodes to the Project window, adjust some Configuration settings, and preview some functionality on the Visualizations window.
Some examples (AM_01, AM_02, AM_03, and AM_06b) are available to all users. These examples can be run without an additional Additive Manufacturing license when you are in DEMO (demonstration) mode. However, the AM Module is not available with the Educational version of Thermo-Calc.
Visualizations
Open the example project file to review the node setup on the Project window and the associated settings on the Configuration window for each node. For some types of projects, you can also adjust settings on the Plot Renderer Configuration window to preview results before performing the simulation. Click Perform Tree to generate plots and tables to see the results on the Visualizations window.
There is a variety of information shown in the Visualizations window that can be viewed during configuration and after performing the calculation(s).
- Geometry: View the geometry and adjust parameters visually by changing inputs on the Configuration window.
- Melt pool and other dynamically changing features can also be visualized and changed.
- Plot results: After completing the set up and performing the calculation, to view the matching name of the node on tab(s) in the Visualizations window, click a Plot Renderer node in the Project window or click the tabs individually in the Visualizations window.
Results Discussion
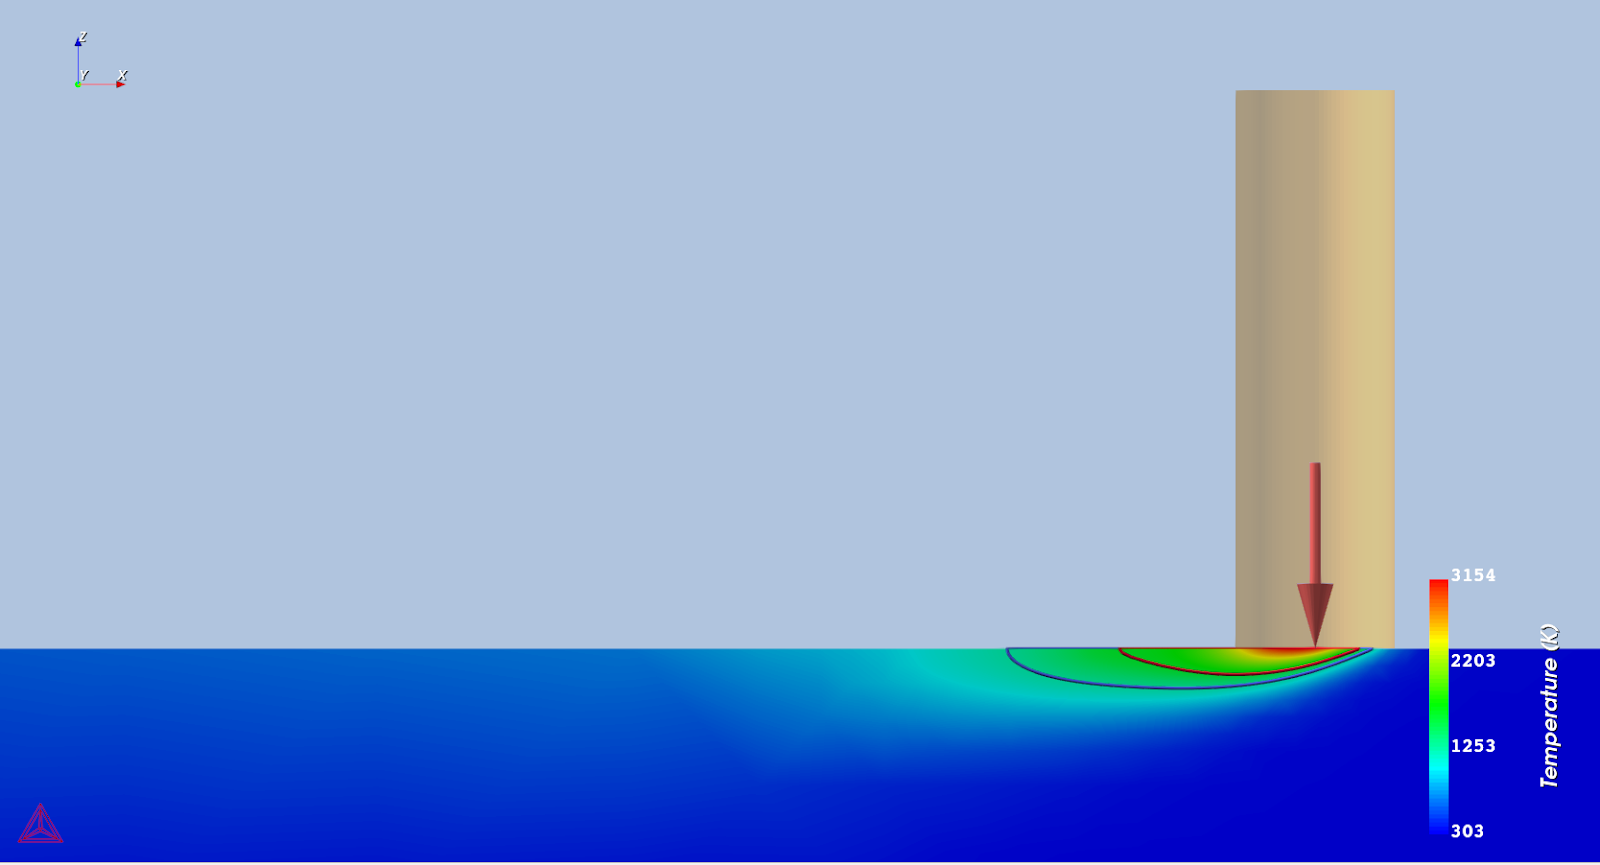
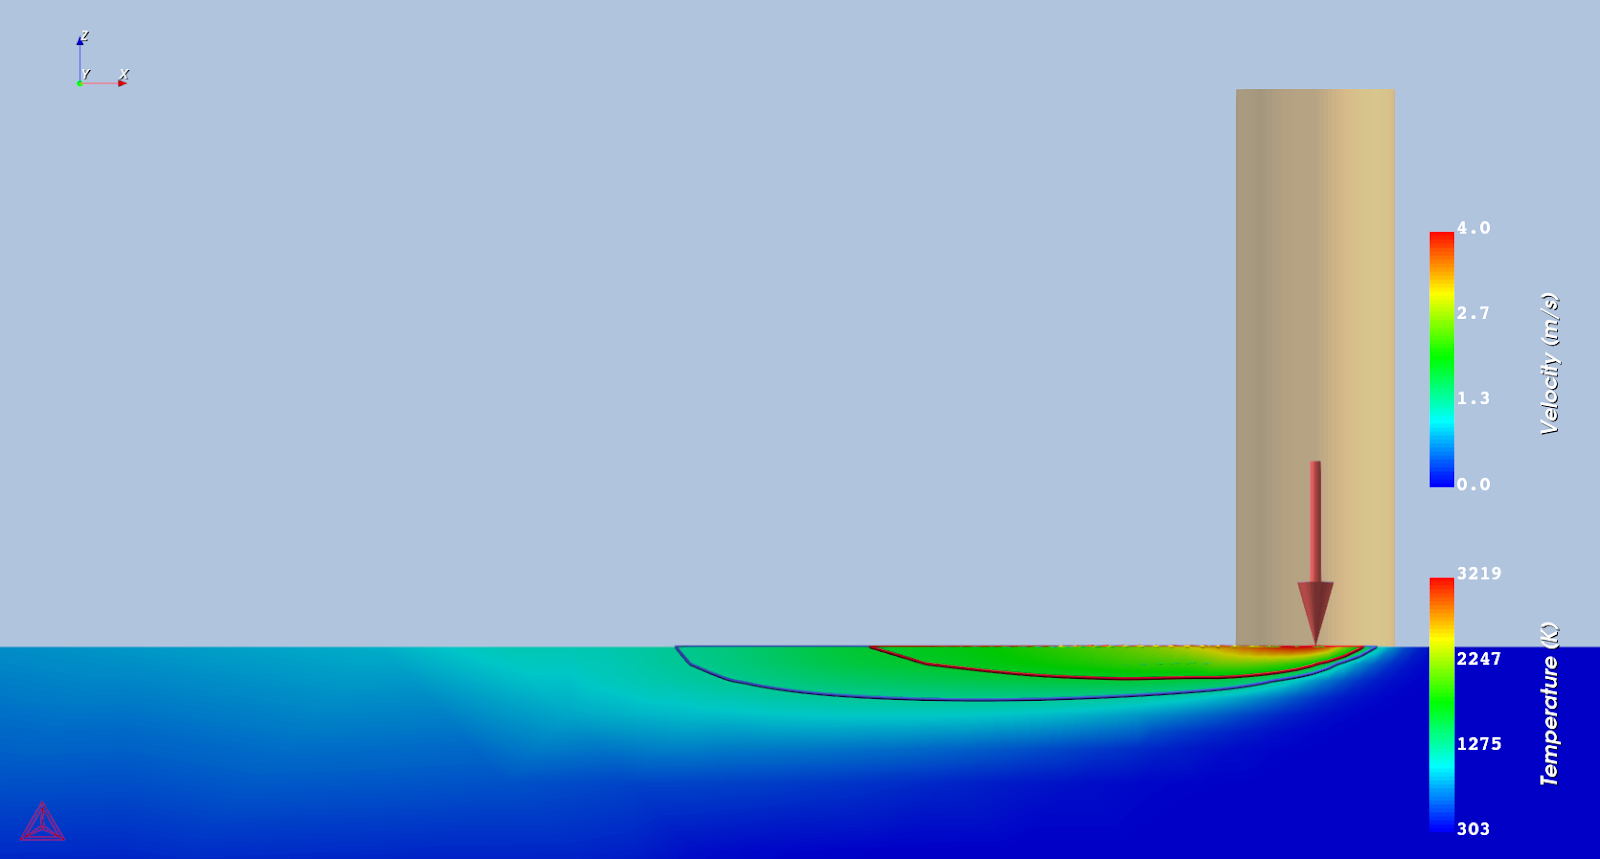
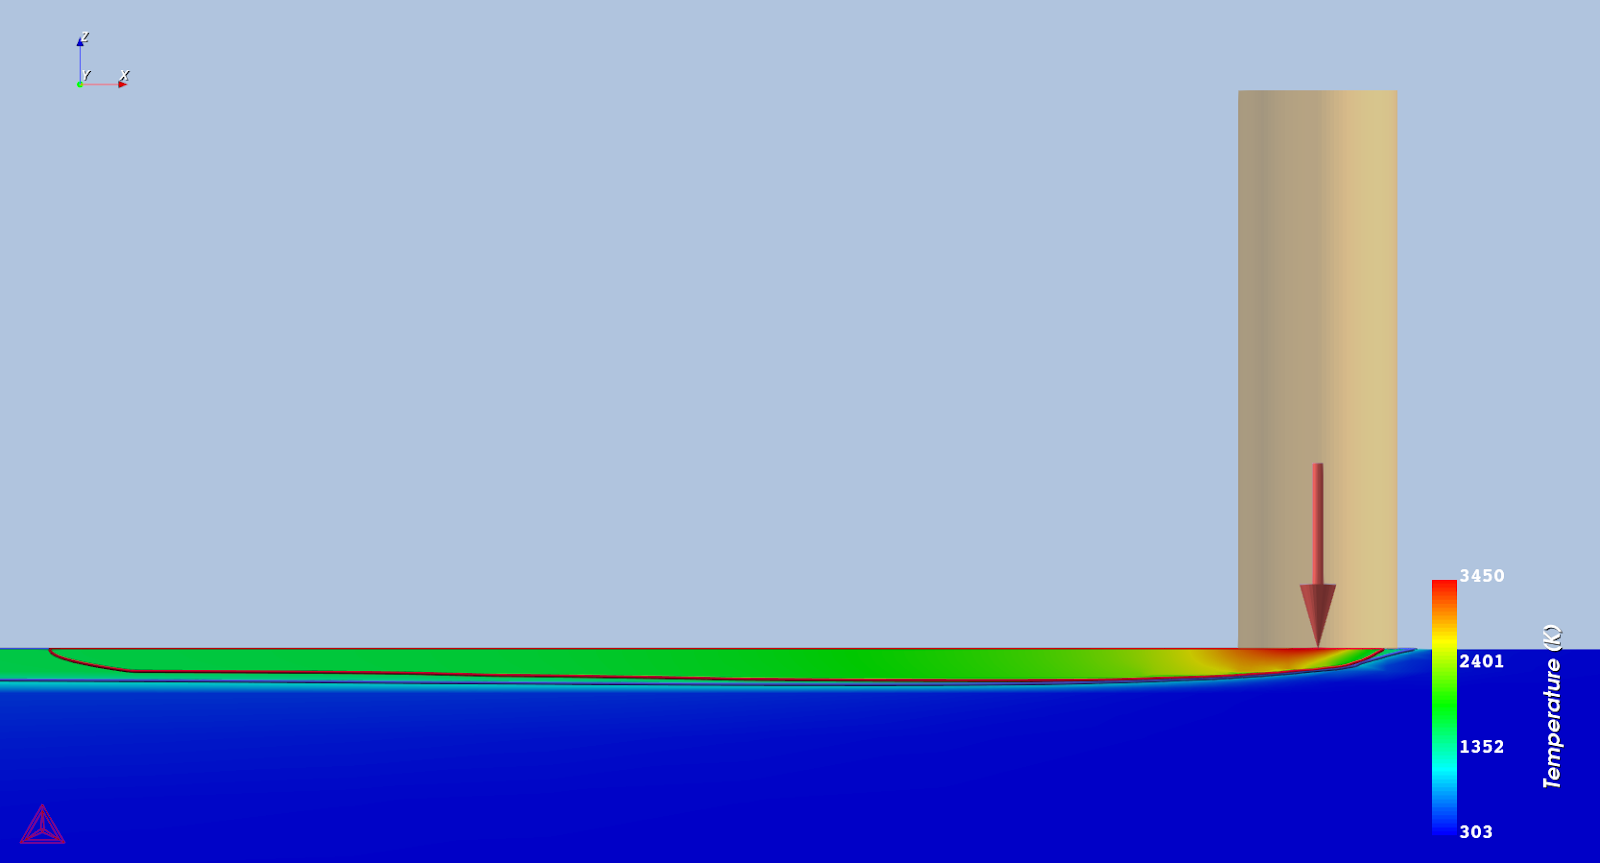
Figure 1: A comparison of the melt pool depth for different simulation conditions; (top) without fluid flow, (middle) with fluid flow in the melt pool and (bottom) with different material properties for the powder layer. Isocontours show the boundaries of (inner) melt pool and (outer) mushy zone.
The table shows a comparison of the melt pool dimensions for different simulation conditions.
| Simulation set up |
Melt Pool Dimensions (mm) |
||
|---|---|---|---|
|
Width |
Depth |
Length |
|
|
Without fluid flow |
0.156 |
0.032 |
0.300 |
|
With fluid flow |
0.188 |
0.040 |
0.619 |
|
Separate powder material properties |
0.250 |
0.039 |
1.670 |
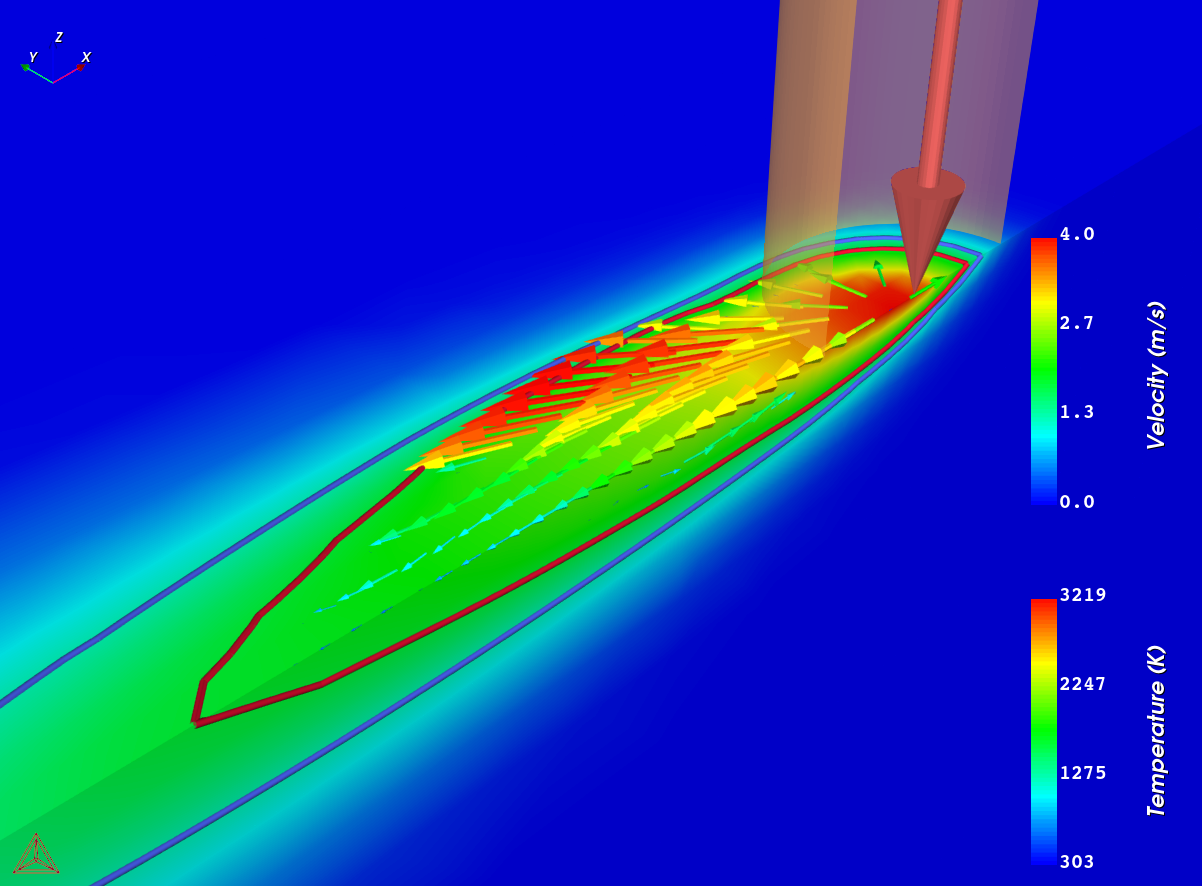
Figure 1 shows the effect of fluid flow on temperature distribution and size of the melt pool for the given process parameters. A quantitative comparison is also given in the table. It can be seen that with the addition of fluid flow due to gradient in surface tension (Marangoni effect), the melt pool tends to increase its dimensions in all three directions. This is because the negative gradient in surface tension with respect to the temperature creates an outward flow on the surface of the melt pool which consequently increases the width and length of the melt pool, as shown in Figure 2.
Figure 2: Vectors showing flow field in the melt pool due to gradient in surface tension. The colours of the vectors represent the magnitude of the velocity. Surface colormap shows the temperature distribution.
|
|
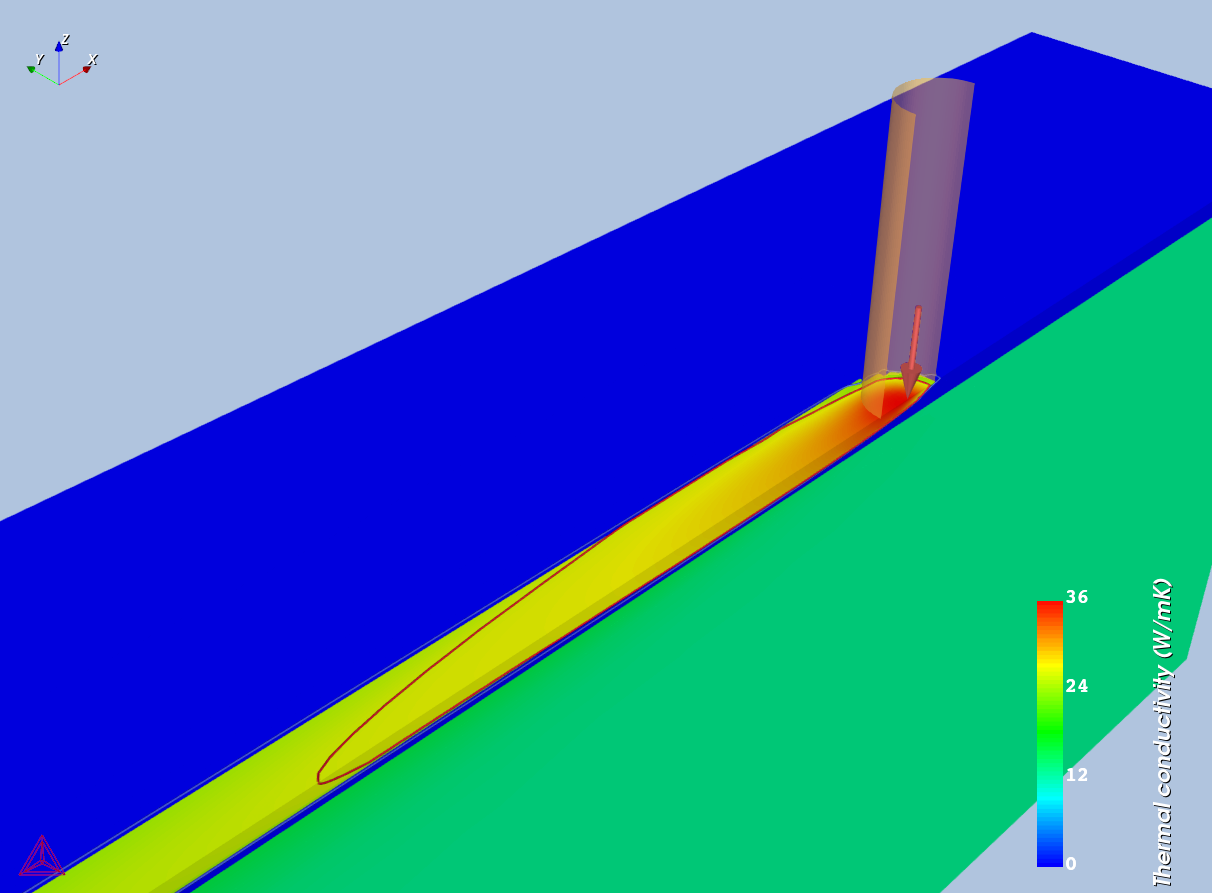
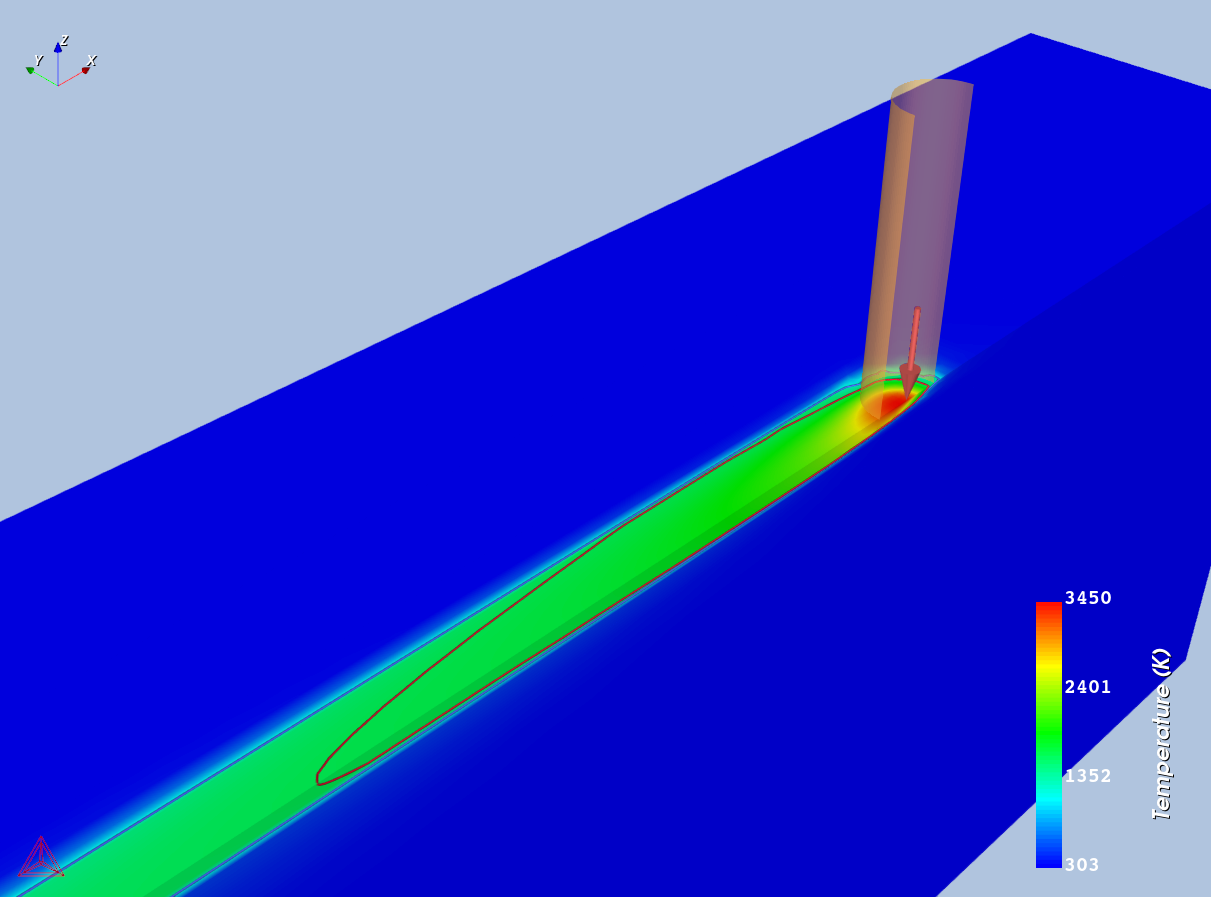
Figure 3: (left) Surface colormap of temperature dependent thermal conductivity showing different values in powder and liquid/solid and (right) the corresponding temperature distribution.
Using separate material properties for powder has a significant effect on both the temperature distribution and the size of the melt pool. This is because a lower thermal diffusivity in the powder makes the temperature to diffuse more towards the length of the melt pool hence causing a significant increase in the length of the melt pool (shown in Figure 3) as compared to the first two cases. There is also an obvious increase in the width of the melt pool while the depth of the melt pool is almost the same as with the fluid flow. Furthermore, the maximum temperature is also highest in the case with separate material properties.
Other Resources
Read more about the Additive Manufacturing (AM) Module on our website including the details about database compatibility or to watch an introductory webinar. You can also use the Getting Started Guide to learn about the key features available.
Many of our Graphical Mode examples have video tutorials, which you can access in a variety of ways. When in Thermo‑Calc, from the menu select Help → Video Tutorials, or from the main My Project window, click Video Tutorials. Alternately, you can go to the website or our YouTube channel.
