AM_11: Comparing Single Tracks Printed on Casted and LPBF Substrates
Bogdonova et al. [2024Bog] performed single track experiments with the alloy Al10SiMg. The study compared the printing of single tracks on two types of substrates—one fabricated with traditional casting and the other with laser powder bed fusion (LPBF).
- Folder: Additive Manufacturing
- File name:
AM_11_Batch_Al10SiMg.tcu
A separate license is required to perform calculations with the Additive Manufacturing (AM) Module. This example also requires an additional database license for the TCS Al-based Alloy Database (TCAL) (TCAL9 and newer).
Background
It is well known that the thermal conductivity of the alloy Al10SiMg is drastically reduced in the as-printed condition when fabricated by LPBF compared to conventionally manufactured counterparts [2022Gha].
Thermal conductivity in Thermo-Calc is modeled as a temperature- and composition-dependent property per phase, and the conductivity of the alloy is taken as an average over the stable phases. The composition of the primary phase can change greatly depending on the fabrication method where the LPBF method results in rapid solidification and solute trapping of solute alloy elements.
Thermal conductivity can generally be reduced by different scattering phenomena (pores, defects, phase interfaces) within the microstructure and can therefore be lower than the calculated conductivity averaged over the phases.
The electrical resistivity due to phase interface scattering is evaluated as the scattering constant times sum of the interaction between the volume fraction of all the phases. The default value for the phase interface scattering constant is found to be 4.0e-8 Ωm for aluminum alloys. The contribution to thermal conductivity is assumed to be related to that of electrical resistivity, following the Wiedemann-Franz law.
The rapid solidification during LPBF generally results in a much finer microstructure compared to traditional casting. LPBF fabricated Al10SiMg solidifies with a cellular primary FCC structure and a eutectic structure between the cells [2021Lef]. An increased interface scattering constant more than 4.0E-8 can be argued given the much finer structure that has a large number of phase interfaces.
In this example the effect on material properties and melt pool dimensions is compared when printing single tracks on the two types of substrates. The material properties for the traditionally cast alloy is calculated using regular Scheil and the default interface scattering constant of 4.0E-8. The material properties for the LBPF fabricated alloy is calculated using Scheil with solute trapping and the effect of increasing the interface scattering is shown.
Visualizations
Open the example project file to review the node setup on the Project window and the associated settings on the Configuration window for each node. For some types of projects, you can also adjust settings on the Plot Renderer Configuration window to preview results before performing the simulation. Click Perform Tree to generate plots and tables to see the results on the Visualizations window.
There is a wide variety of information shown both in the Visualizations and Plot Renderer Configuration windows that can be viewed during configuration and after performing the calculation(s). Not all views, such as the Geometry or previews, nor all additional output (i.e. plots) are shown in this section and it is recommended that you open and run the example to review all available options and results.
When you run (Perform) this example, it can take around two hours to complete the calculations.
Material Properties for the As-cast Substrate Material
The TCS Al-based Alloy Database (TCAL) is selected on the System Definer (renamed to Scheil As-cast). The as-cast Al10SiMg alloy has the composition of Al-10.8Si-0.3Mg-0.1Cu-0.1Fe.
The Scheil Calculator (renamed to Scheil As-cast) is configured with default settings for AM with an evaluation of thermophysical properties from 5000 K down to room temperature. The Calculation type is set to Classic Scheil.
Material Properties for the LPBF Printed Substrate Material
The TCS Al-based Alloy Database (TCAL) is selected in the System Definer (renamed to Scheil printed). The LPBF Al10SiMg alloy has almost the same composition (Al-10.8Si-0.3Mg-0.1Cu-0.2Fe) with only a small difference in Fe content.
The Scheil Calculator (renamed to Scheil Solute-Trapping) is configured with the default settings for AM with an evaluation of thermophysical properties from 5000 K down to room temperature. The Calculation type is set to Scheil with solute trapping.
Comparing Material Properties Between the Substrates
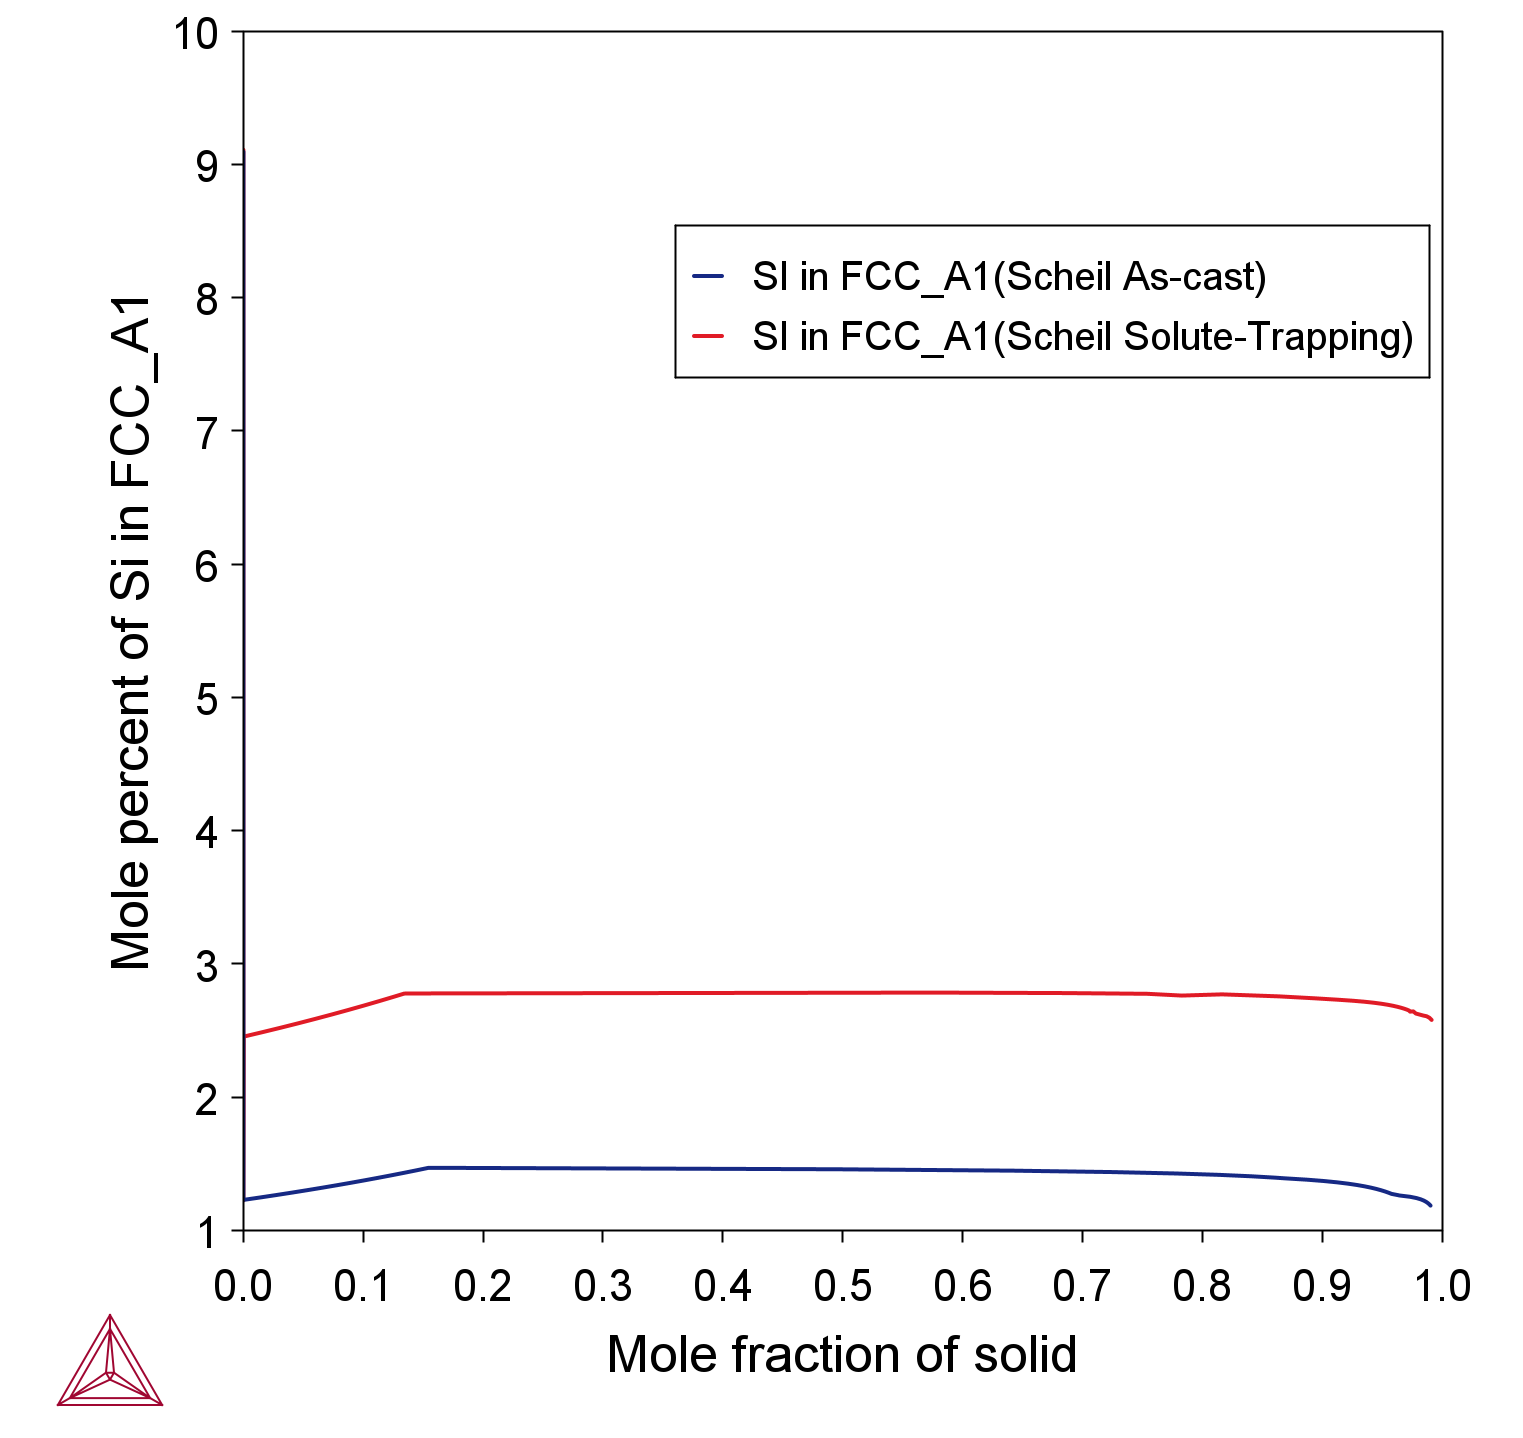
Two plots overlay results from the two Scheil Calculators in Figure 1. The Plot Renderer, renamed to Si in primary FCC, shows the Si content in the primary FCC phase. The classic Scheil calculation gives less than 1.5 at% Si. The solute trapping simulation results in twice the Si content with about 3 at% Si in the primary FCC phase. Atom probe experiments for a LPBF printed Al10SiMg alloy measured 3.08 at% Si in the FCC cell structure for the as-printed condition [2021Lef].
Figure 1: Silicon content in the primary FCC phase comparing regular (classic) Scheil with Scheil and solute trapping. The solute trapping almost doubles the Si content in the primary FCC phase.
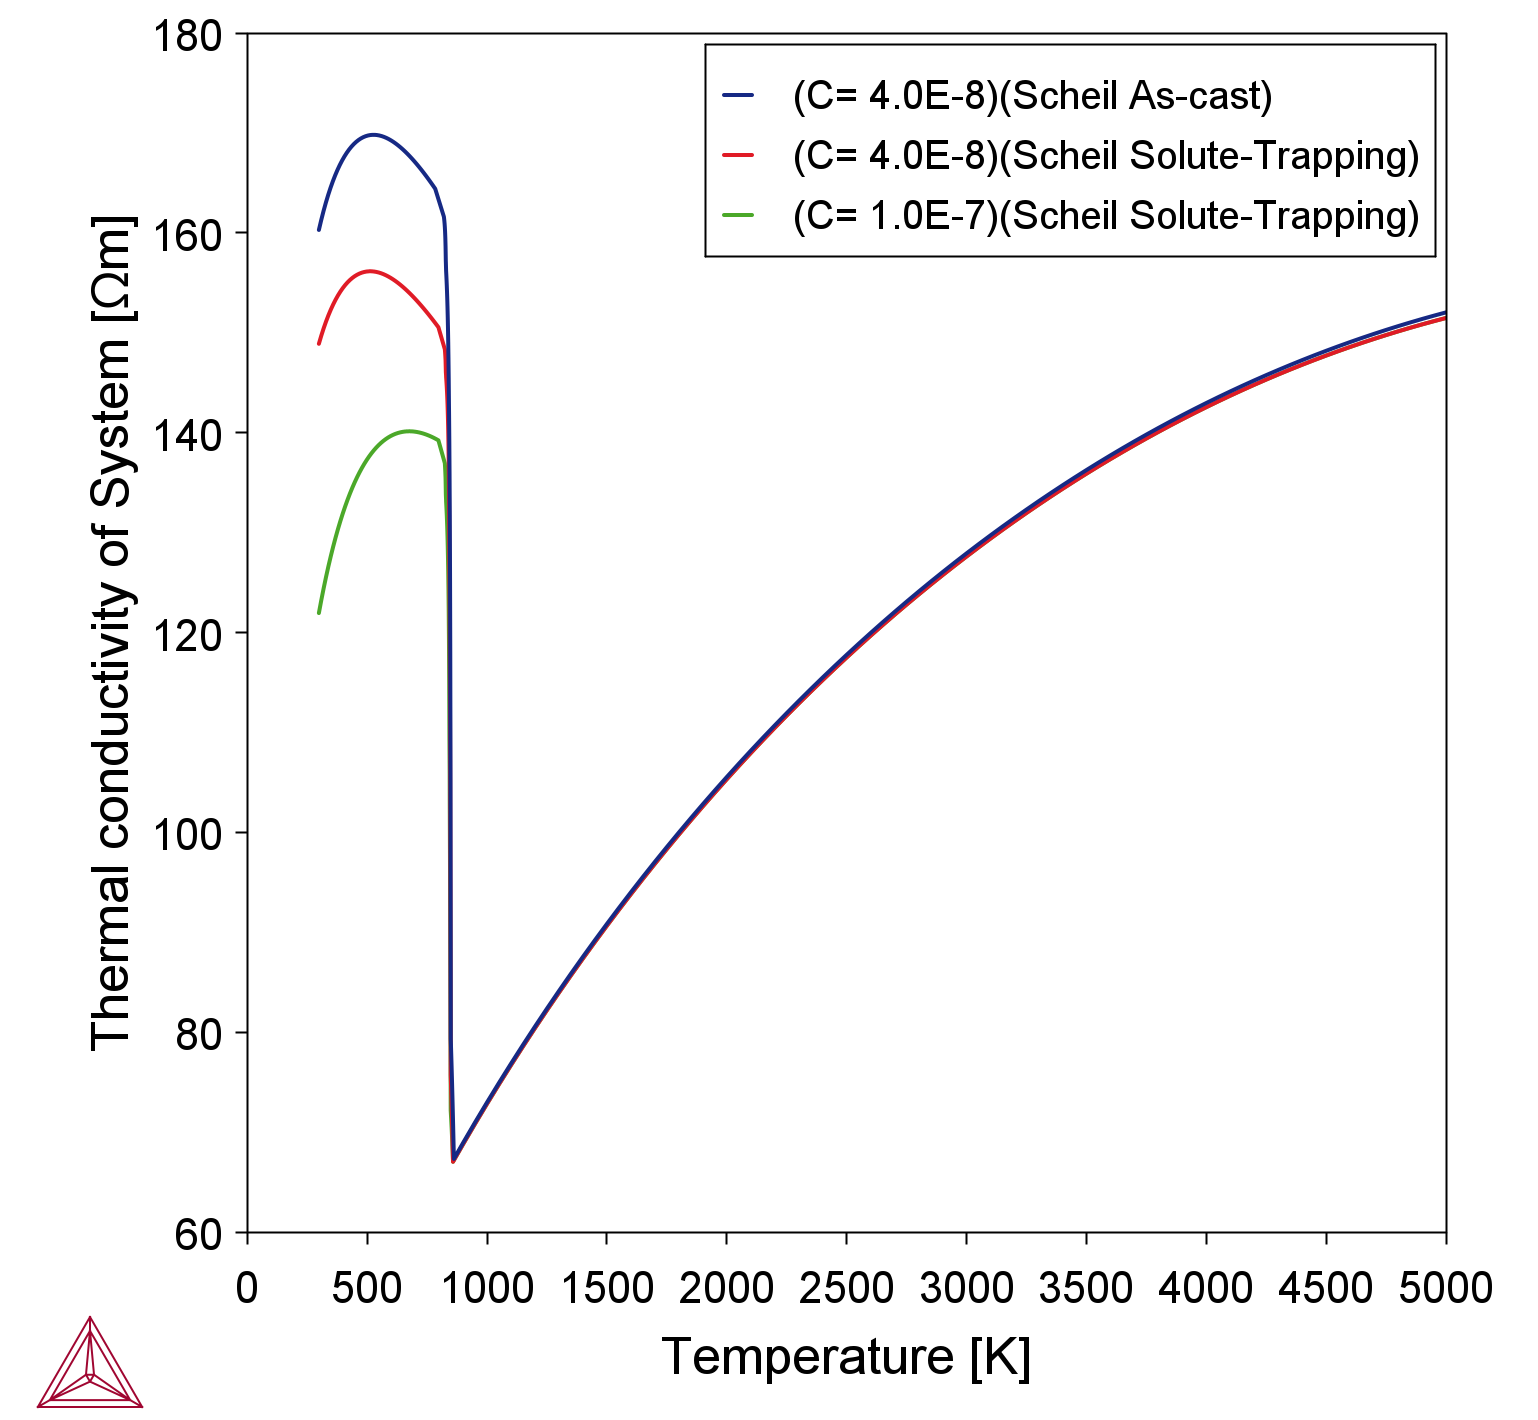
Figure 2 is another overlaid plot that takes the results from two Scheil Calculator predecessors to show how the thermal conductivity varies with temperature. The conductivity for the as-cast substrate (blue line), that uses classic Scheil and the default setting for the phase interface scattering constant (C = 4.0E-8), naturally gives the highest thermal conductivity. The red line shows the reduction in conductivity due to solute trapping and the increased Si content in the primary phase. The green line shows further reduction in thermal conductivity due to the increased interface scattering when the scattering constant was increased (C = 1.0E-7).
Figure 2: Thermal conductivity for as-cast substrate and printed substrate. Blue line shows conductivity for as-cast structure using the default setting for the interface scattering constant (C = 4.0E-8). The red line shows the reduced conductivity due to the solute trapping. Finally, the green line shows further reduction in thermal conductivity due to increased interface scattering where C = 1.0E-7.
Batch AM Steady-State Simulations
Two AM Calculators are next set up. These are renamed to As-cast Batch and AM Batch. These AM batch steady-state simulations are configured with similar settings, except for the interface scattering and the measured experimental melt pool dimensions that are different for the as-cast and LPBF fabricated substrates. The interface scattering settings are found on the Material Properties tab for both AM Calculators:
- The as-cast substrate uses the default interface scattering (
C = 4.0E-8). - The LPBF as-printed substrate uses the increased value for interface scattering (
C = 1.0E-7).
The shared settings in the AM Calculator configuration (on the Conditions tab) are:
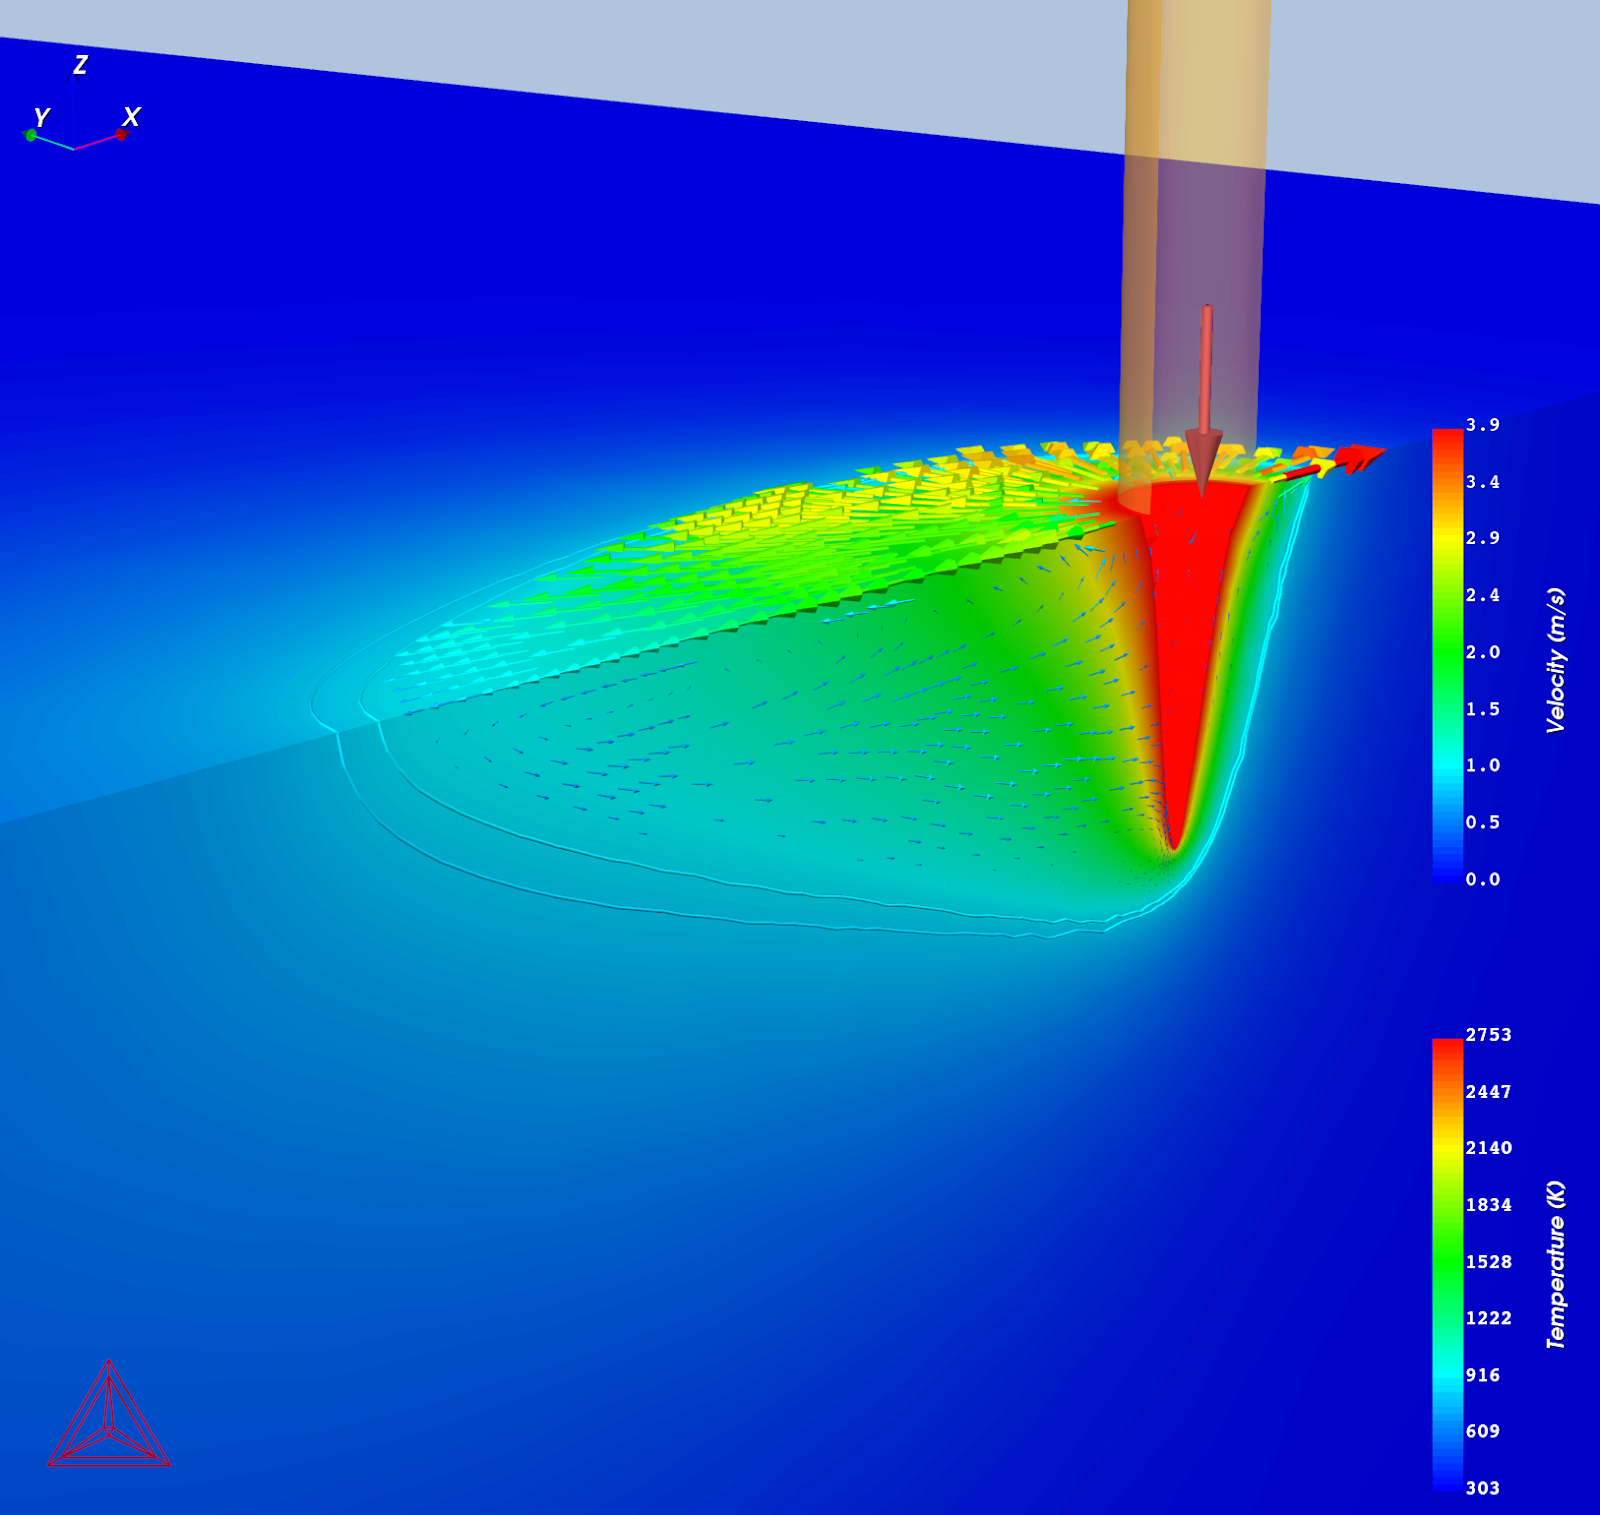
- Uses Fluid flow including Marongoni effect and the keyhole model.
- Absorptivity is selected as Calculated and the with prefactor is set to
1.8times the calculated value in order to match the experimental melt pool dimensions.The need to use a large prefactor is probably related to surface oxides and that the calculated absorptivity is for an oxide free liquid surface. The stable oxide Al2O3 often forms at the surfaces of Al-alloys where it remains in solid form to above 2000 °C and evaporates well above 3000 °C.
Figure 3: The settings window for an AM steady-state simulation for the As-cast Batch calculator. Fluid flow and Gaussian heat source with keyhole model are enabled, plus it uses a calculated absorptivity with a prefactor set to 1.8.
To reduce total calculation time, for each AM Calculator only 5 of the 12 experiments are selected on the Plot Renderer (click Show Table to see the details). However, the example still takes about two hours to perform.
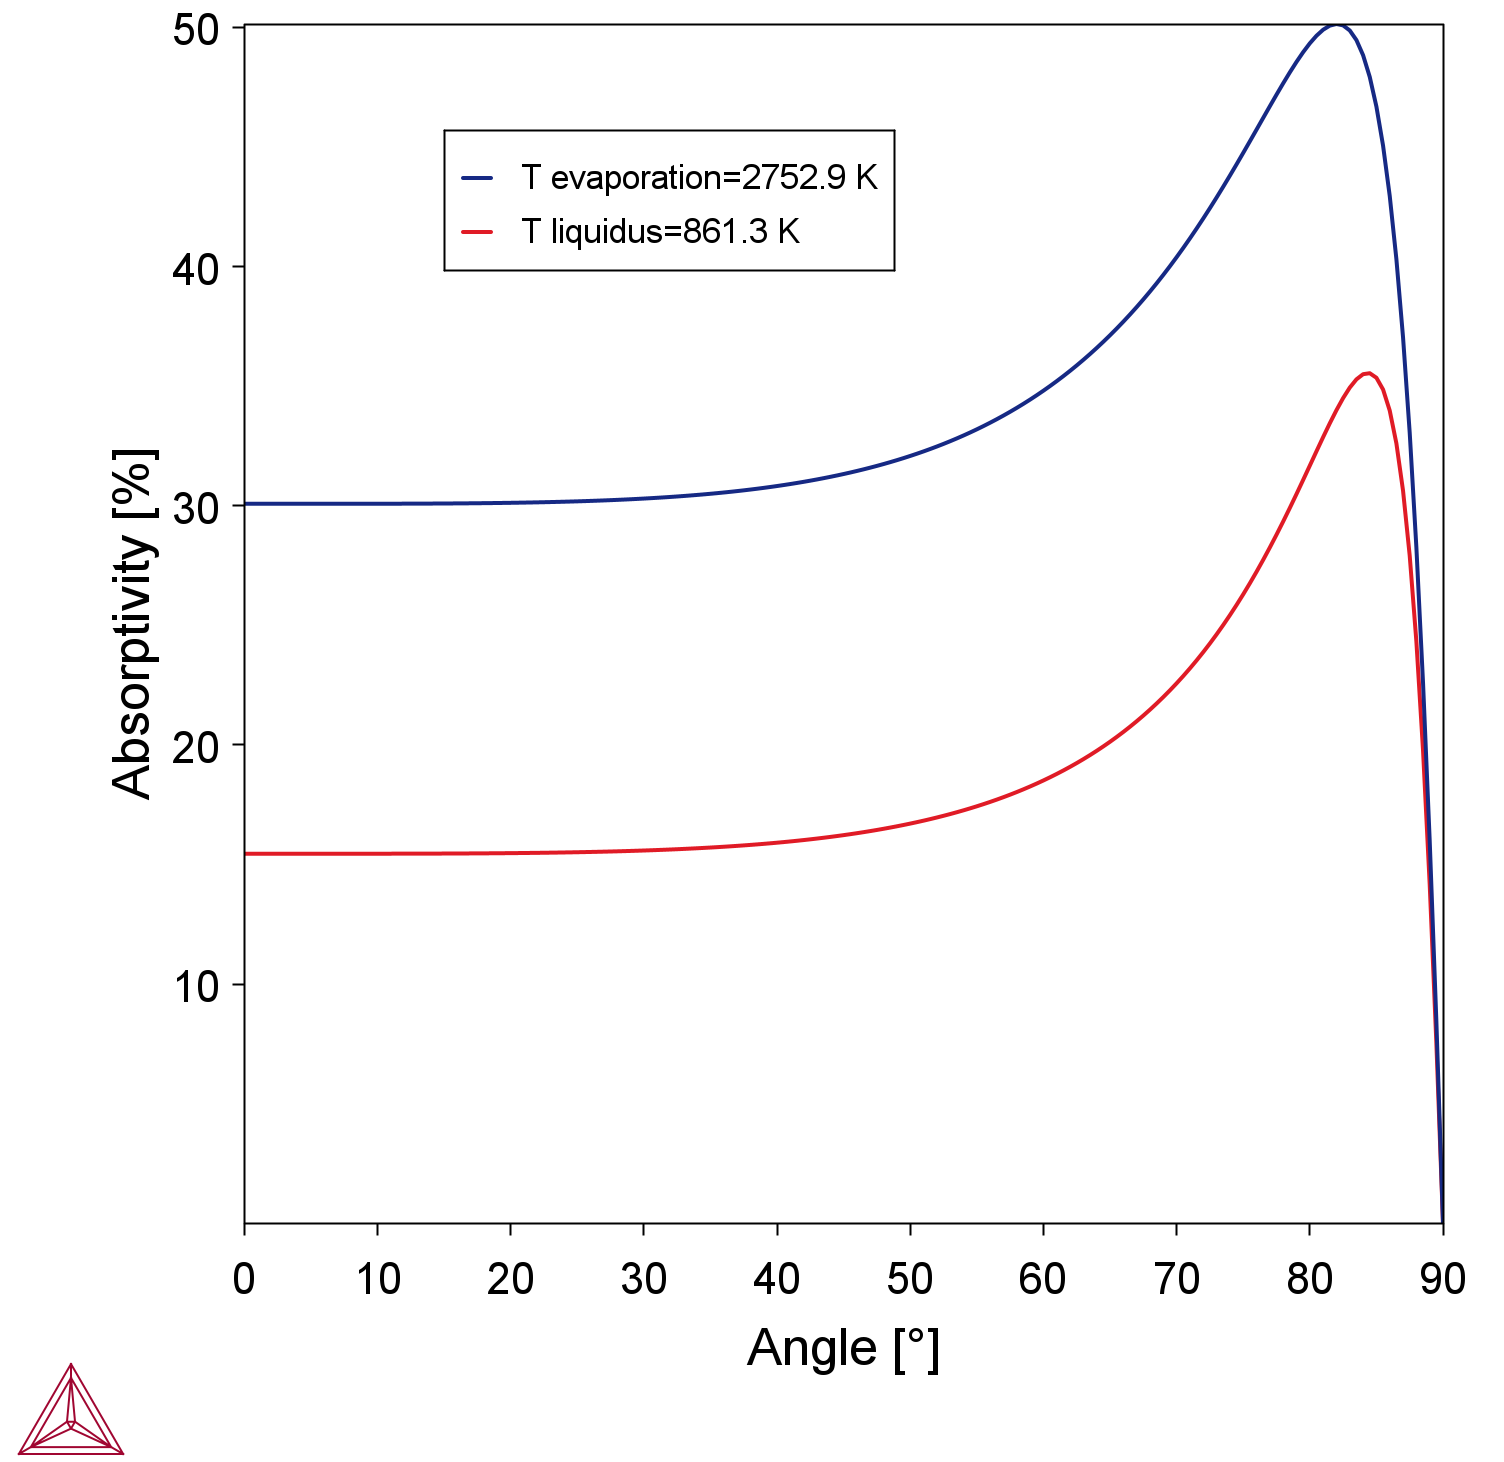
Figure 4: The temperature- and incident angle-dependent absorptivity. Red curve shows the absorptivity as a function of incident angle at the liquidus temperature, the blue curve shows the corresponding absorptivity at the evaporation temperature.
Turbulent Flow - Large Eddy Simulations
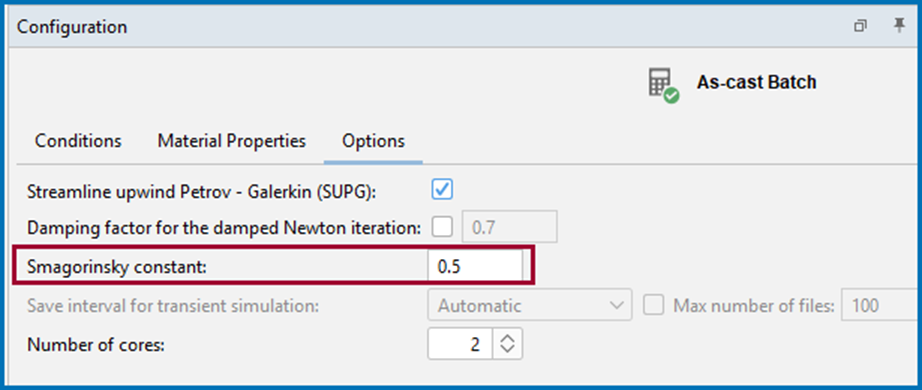
Al-alloys have in general lower viscosity compared to other metallic alloys (e.g. Ti-, Fe- or Ni-based alloys). The low viscosity in combination with high fluid flow rates can result in turbulent flows. This happens in this example for the simulations at the higher energy densities. The turbulent flow model implemented in the AM simulation is based on Large Eddy Simulations (LES) where the large-scale motions are represented directly and smaller-scale motions are modeled. A larger Smagorinsky constant filters more small-scale motions to be modeled. The example increases the Smagorinsky constant to 0.5. The simulations with the highest energy densities will otherwise fail to converge with the default value of 0.18.
Figure 5: On the Options tab for the AM Steady-State simulation (As-cast Batch) with an increased Smagorinsky constant to handle the high turbulent flows.
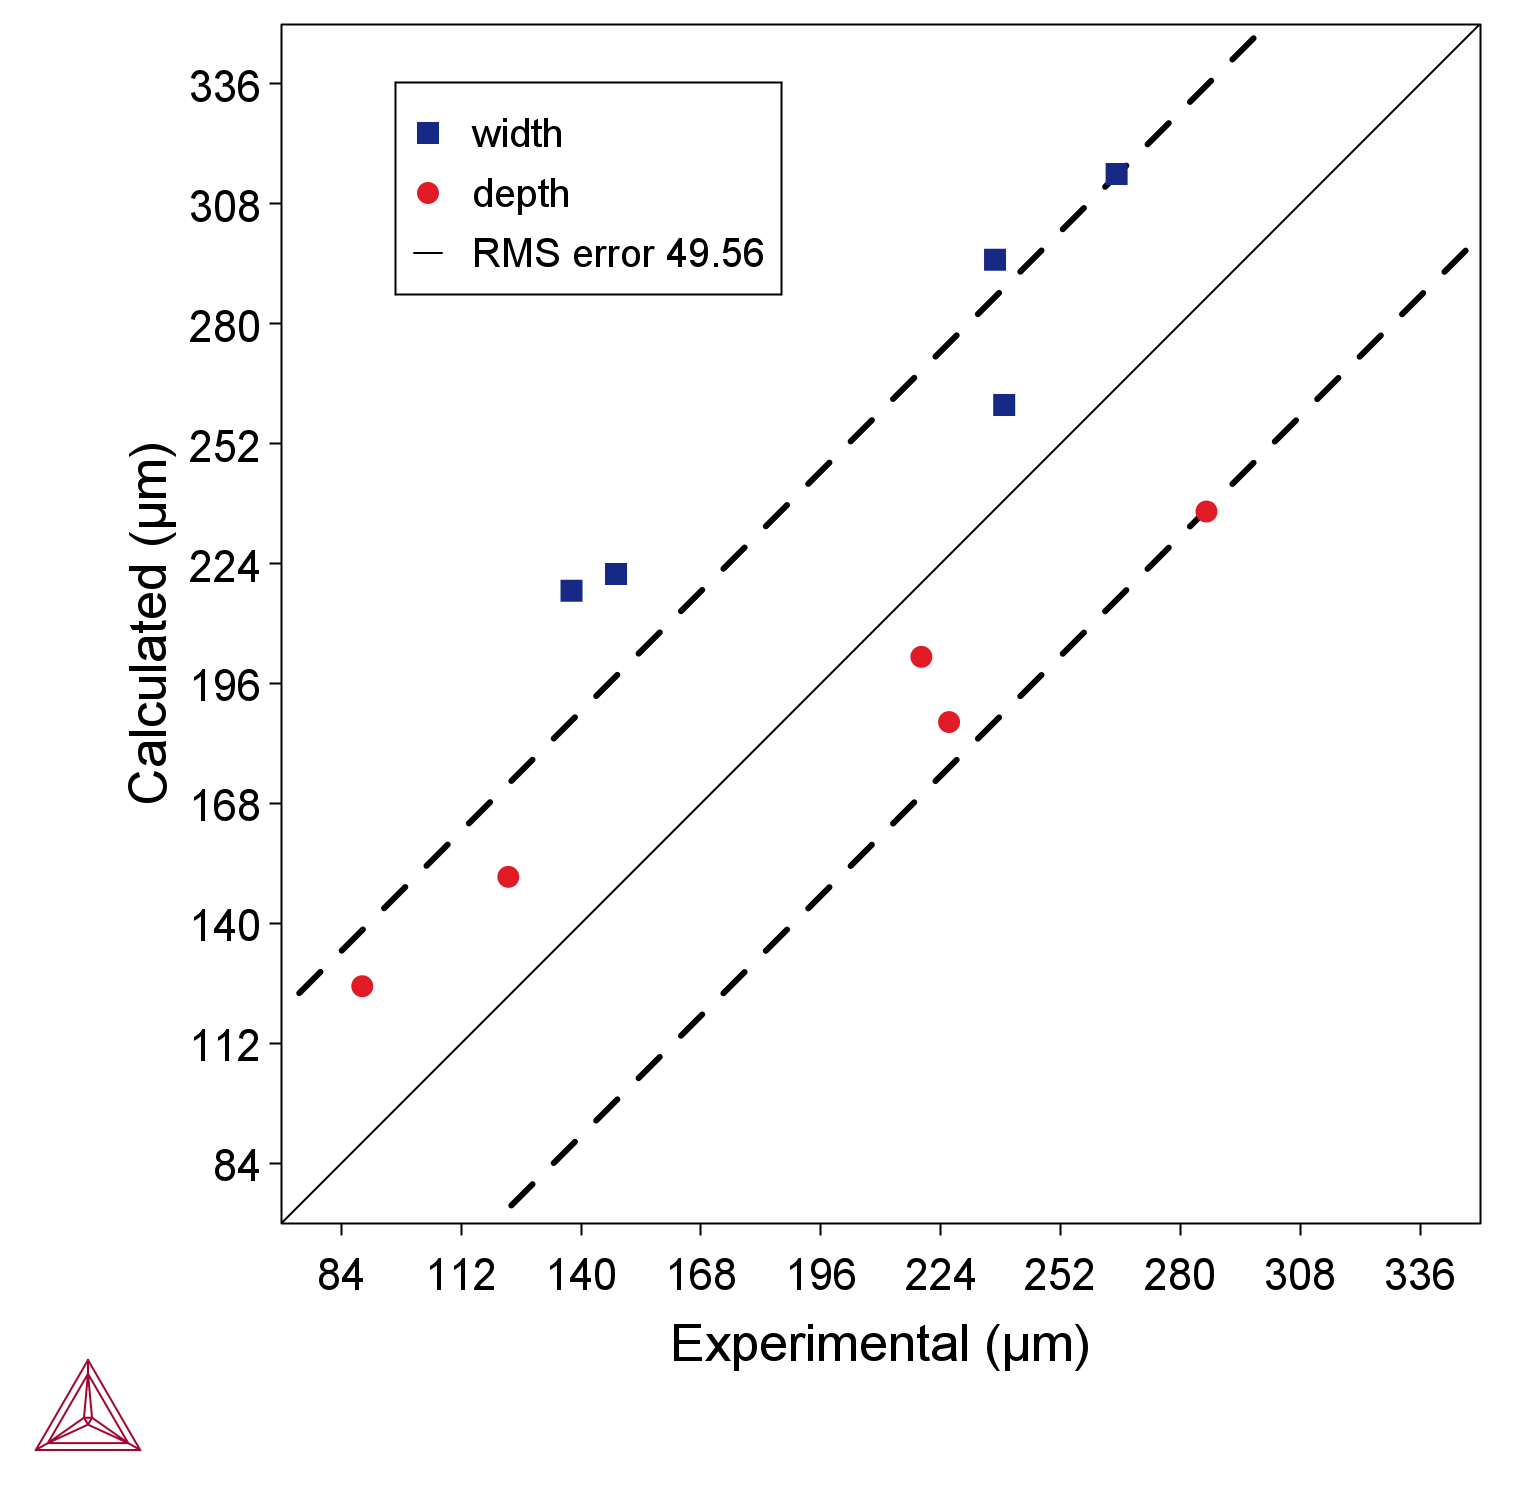
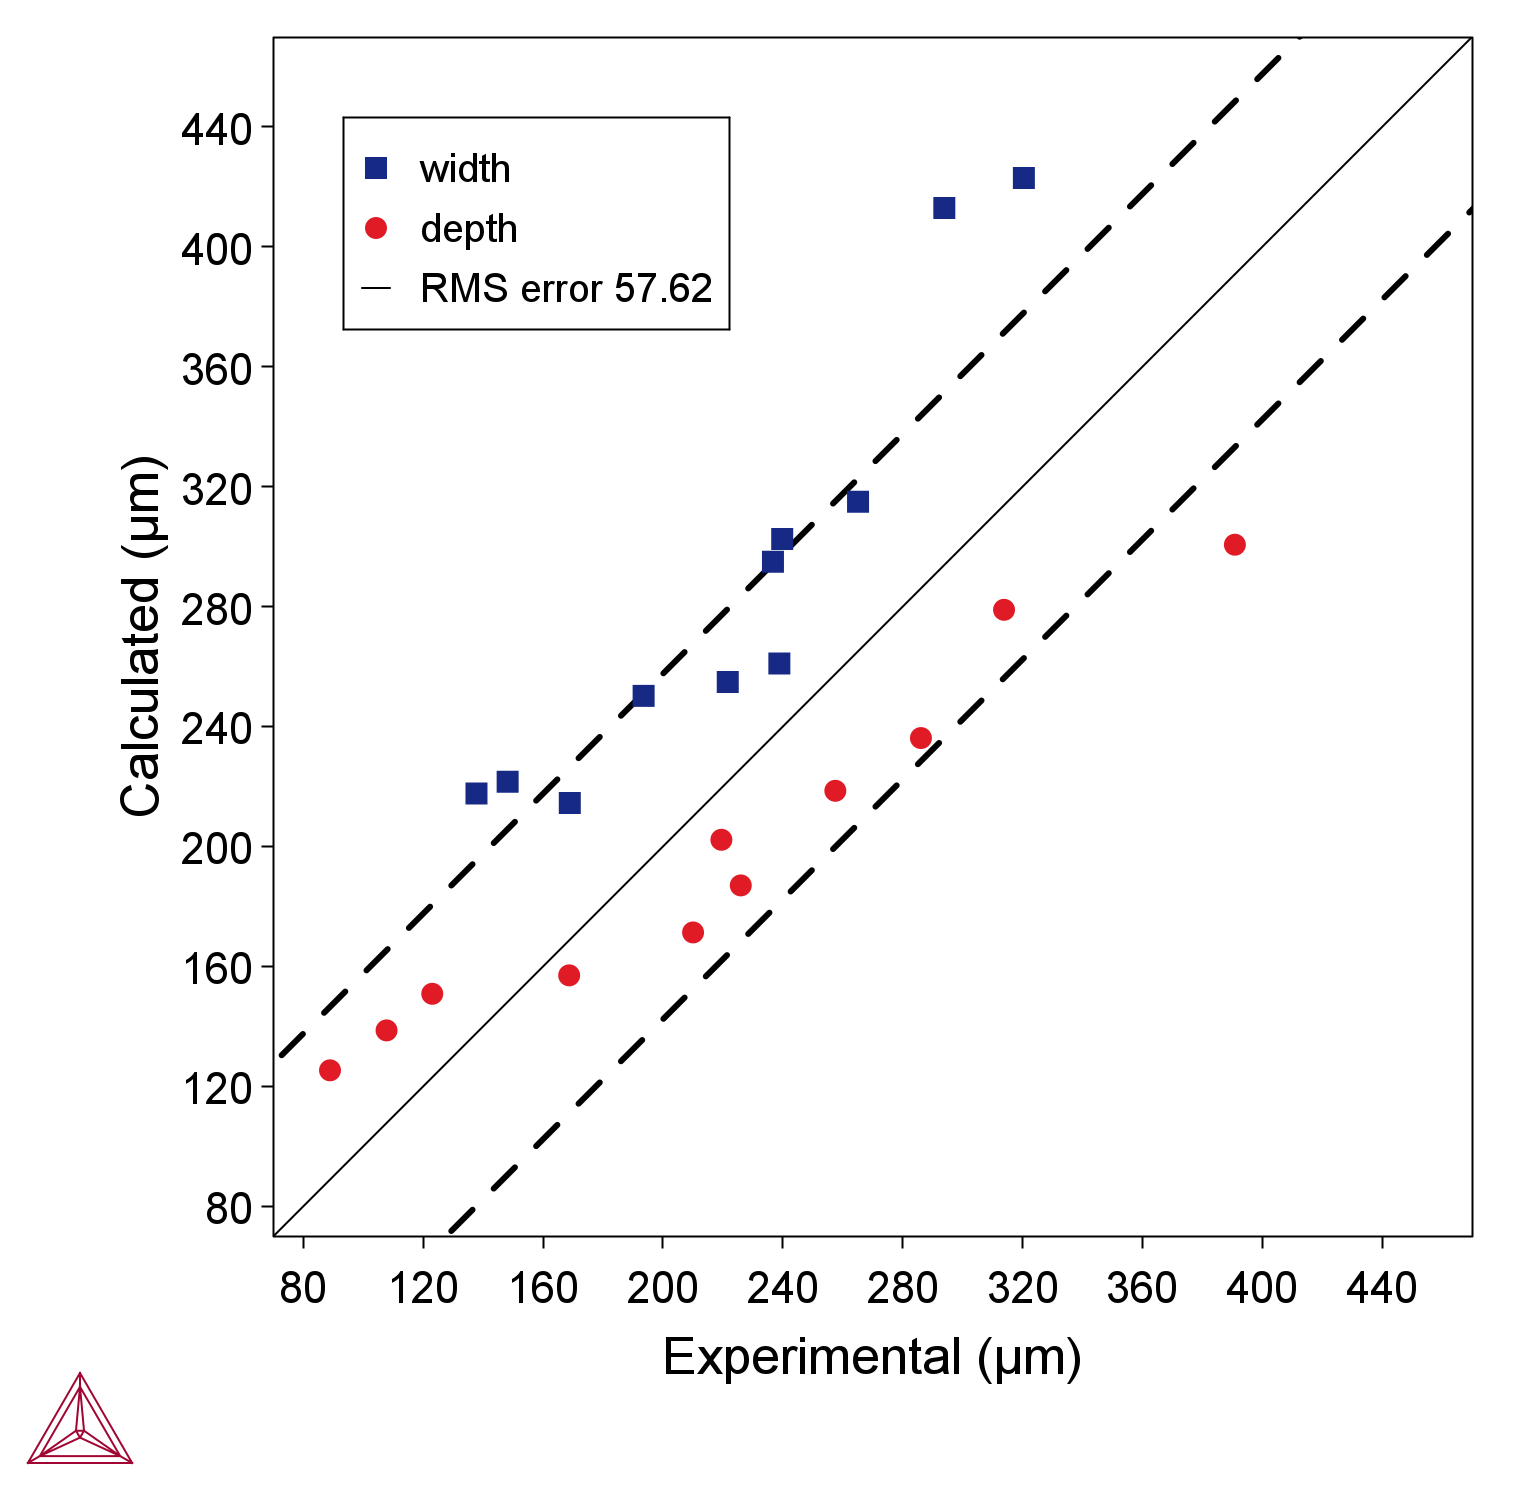
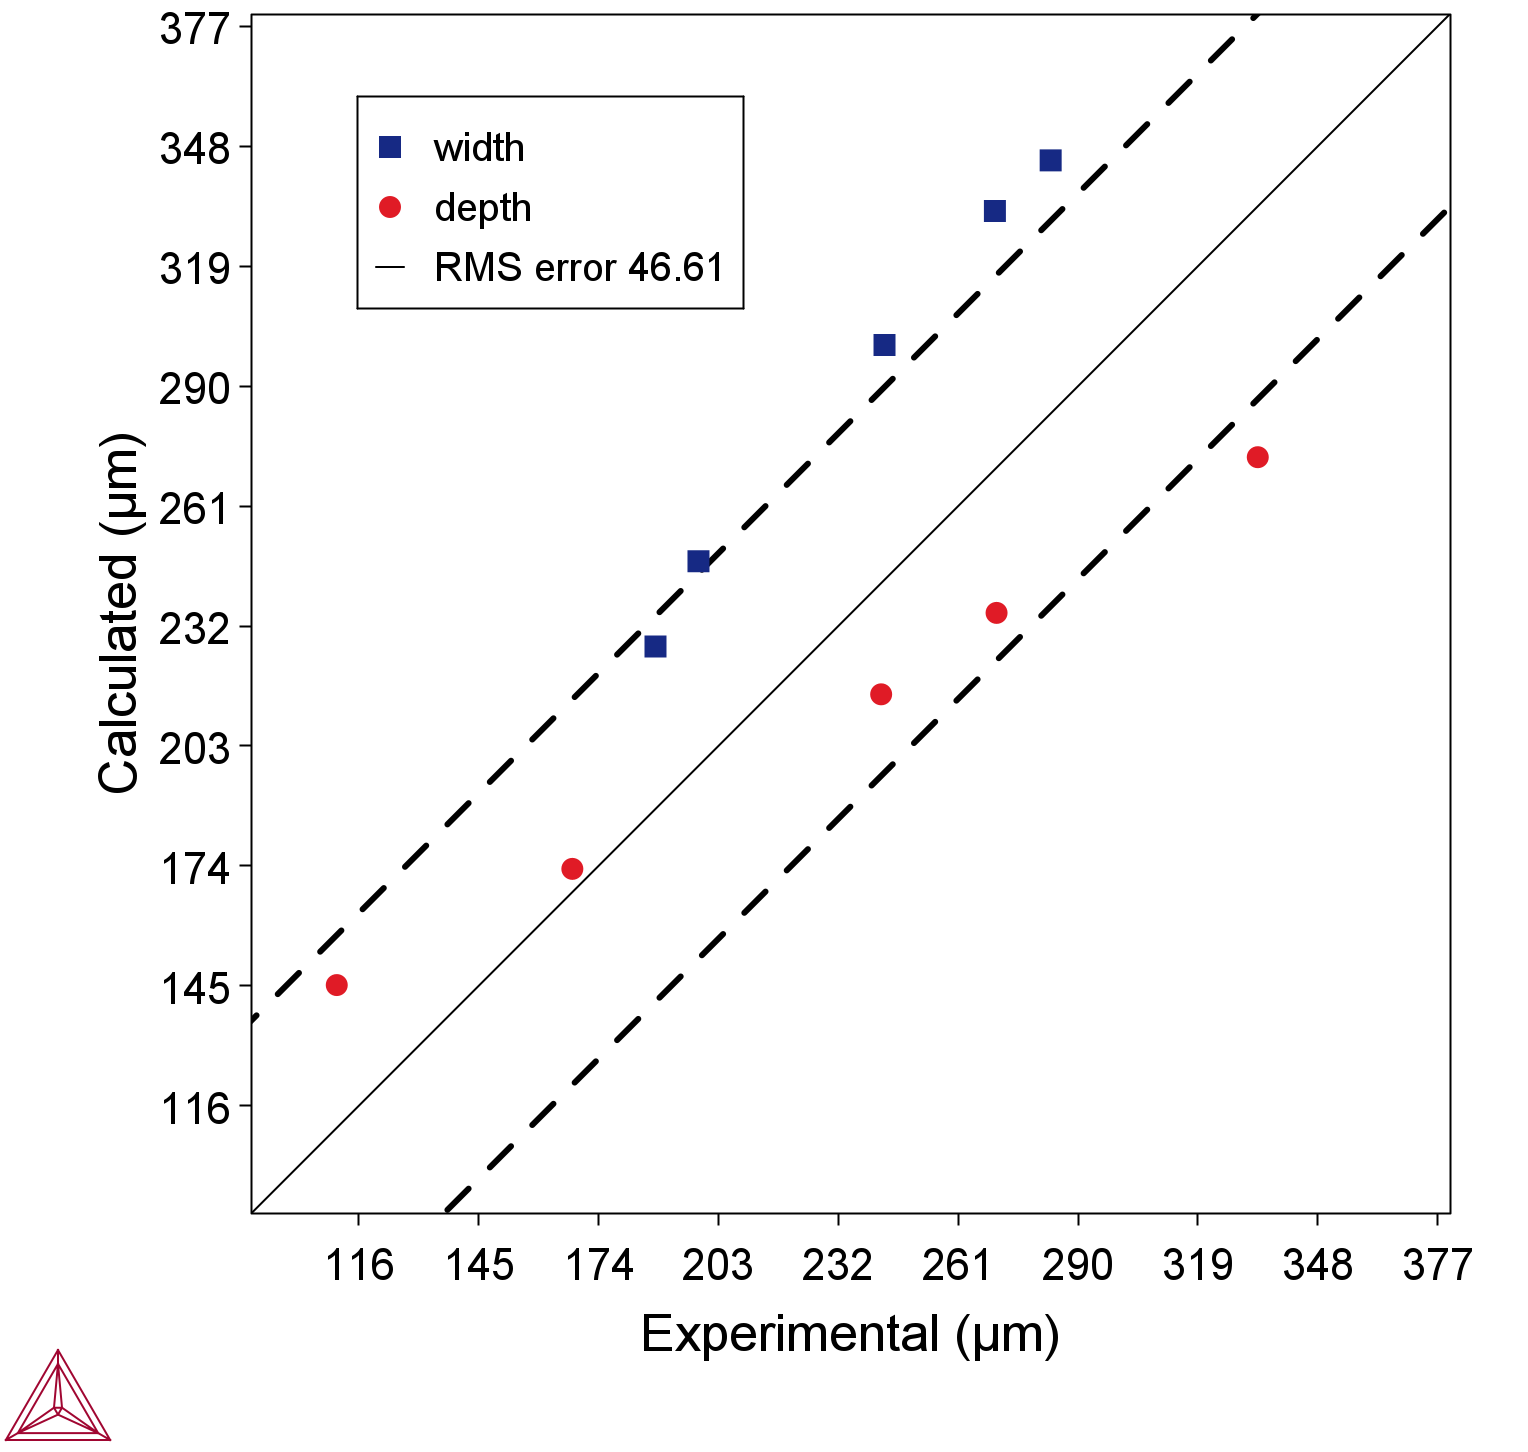
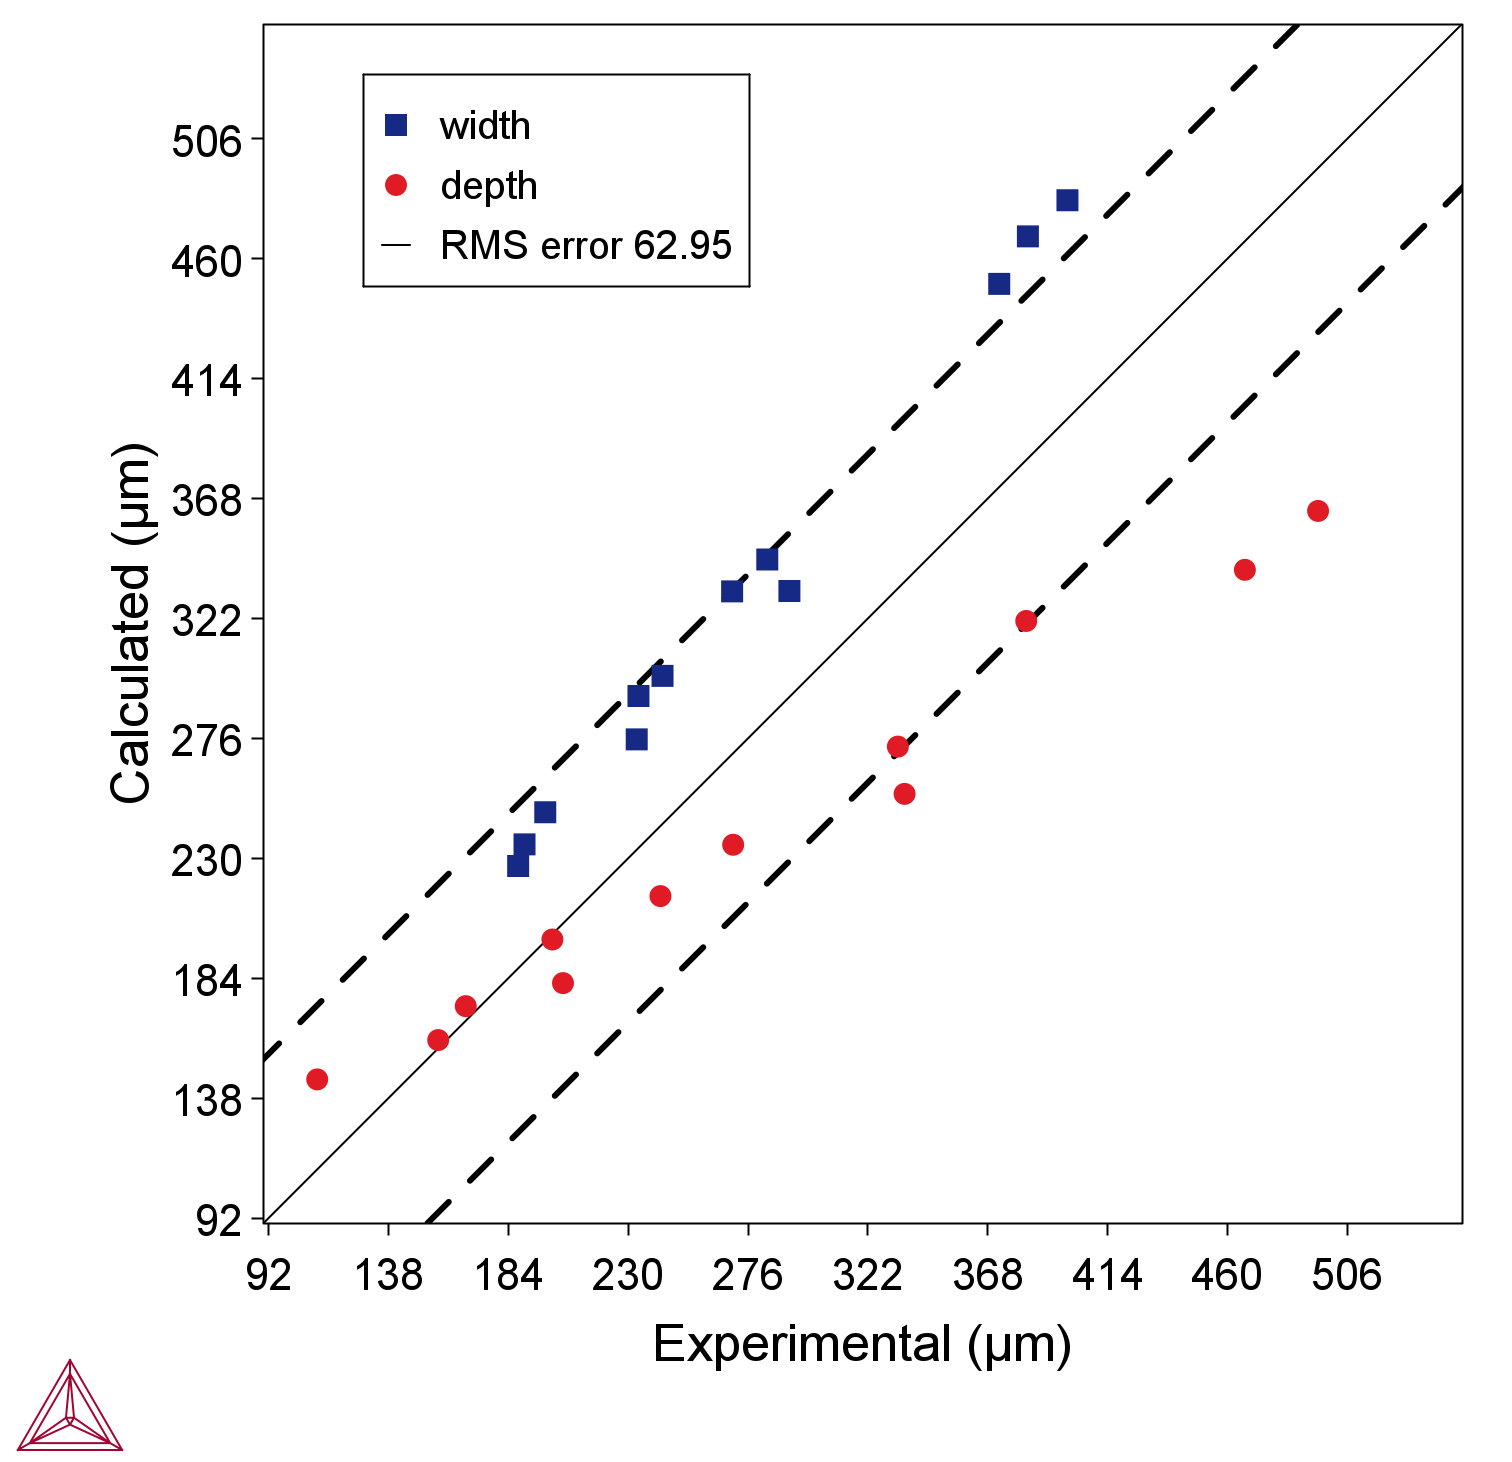
The following parity plot examples compare the experimental versus calculated melt pool dimensions. In general a good trend can be seen for both the simulations with the as-cast and LPBF fabricated substrates. The experimental melt pools are in general deeper than the simulated with an increasing error with increasing depth of the melt pool.
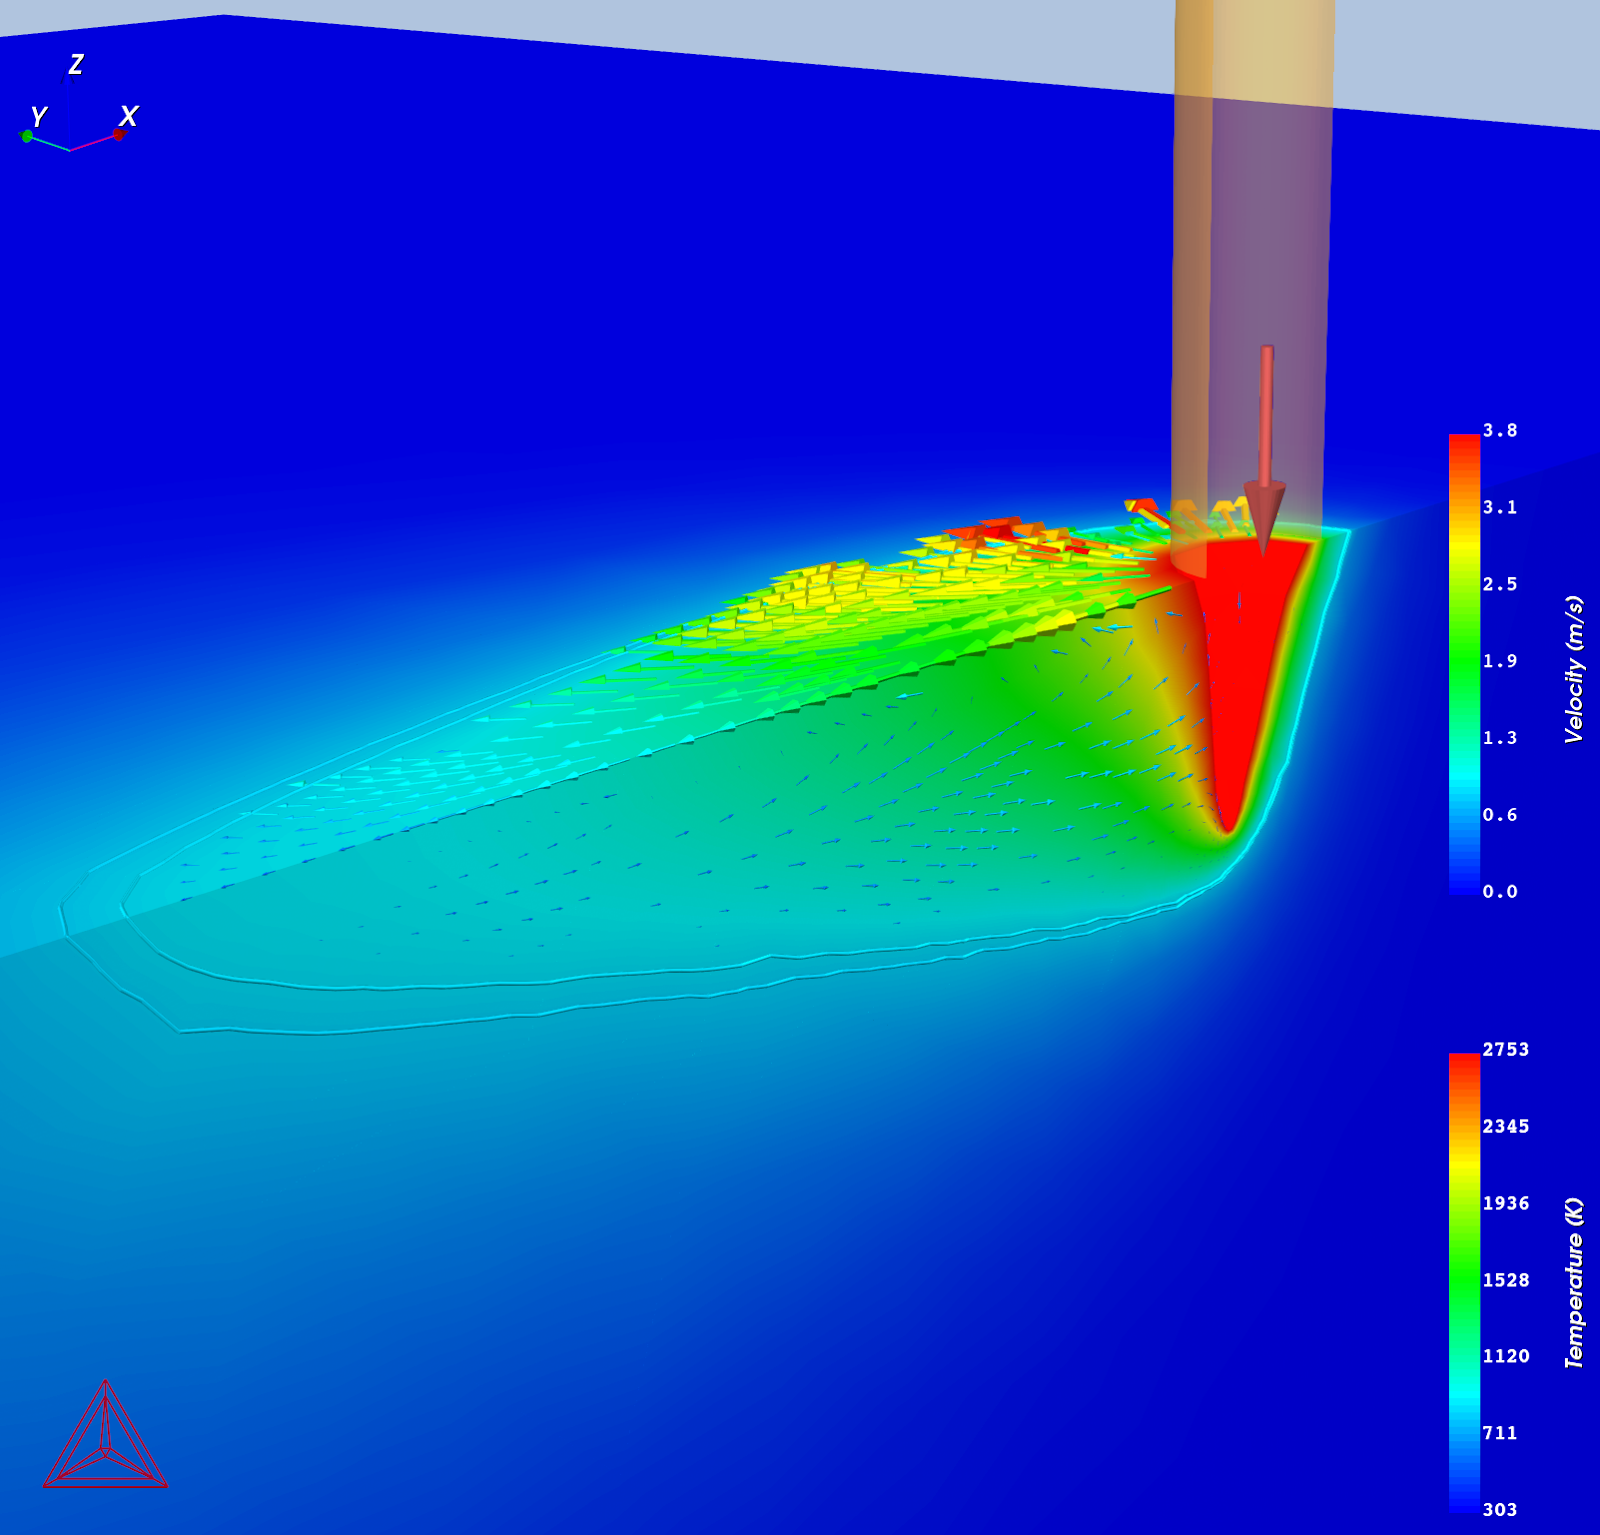
Figure 11: 3D plot of melt pool for LPBF printed substrate where P = 325 W and scanning speed = 1200 mm/s.
References
[2021Lef] W. Lefebvre, G. Rose, P. Delroisse, E. Baustert, F. Cuvilly, A. Simar, Nanoscale periodic gradients generated by laser powder bed fusion of an AlSi10Mg alloy. Mater. Des. 197, 109264 (2021).
[2022Gha] A. Ghasemi, E. Fereiduni, M. Balbaa, M. Elbestawi, S. Habibi, Unraveling the low thermal conductivity of the LPBF fabricated pure Al, AlSi12, and AlSi10Mg alloys through substrate preheating. Addit. Manuf. 59, 103148 (2022).
[2024Bog] M. Bogdanova, S. Chernyshikhin, A. Zakirov, B. Zotov, L. Fedorenko, S. Belousov, A. Perepelkina, B. Korneev, M. Lyange, I. Pelevin, I. Iskandarova, E. Dzidziguri, B. Potapkin, A. Gromov, Mesoscale Simulation of Laser Powder Bed Fusion with an Increased Layer Thickness for AlSi10Mg Alloy. J. Manuf. Mater. Process. 8, 7 (2024).
Other Resources
Read more about the Additive Manufacturing (AM) Module on our website including the details about database compatibility or to watch an introductory webinar. You can also use the Getting Started Guide to learn about the key features available.
Many of our Graphical Mode examples have video tutorials, which you can access in a variety of ways. When in Thermo‑Calc, from the menu select Help → Video Tutorials, or from the main My Project window, click Video Tutorials. Alternately, you can go to the website or our YouTube channel.
